
- Description
- Indicator Settings
Description
Important shifts in this ratio do not have an indicator that can be activated by default in the MT4 terminal. Because of this, we recommend that you take a look at the free Shved Supply & Demand indicator that was made specifically for detecting and automatically drawing levels like that.
Contents:
1. Description Shved Supply & Demand indicator.
2. How does the Shved Supply & Demand Indicator plot zones?
3. Some real-world applications of the Shved Supply & Demand Indicator
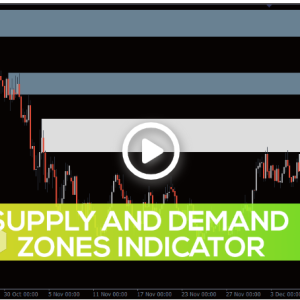
1. Description Shved Supply & Demand Indicator
When the Forex market was more active in the past, it was usually in the supply and demand zones.
We find these numbers intriguing because we can utilise the price’s recurring interaction with them to find entry points to trades that could be successful.
The Shved Supply & Demand Indicator, from which a pretty strong targeted movement has already taken place, are used to draw the levels.
The price action close to the zones determines their height. The levels will appear higher if they have consistently piqued traders’ interest and the price has moved up or down in response to them.
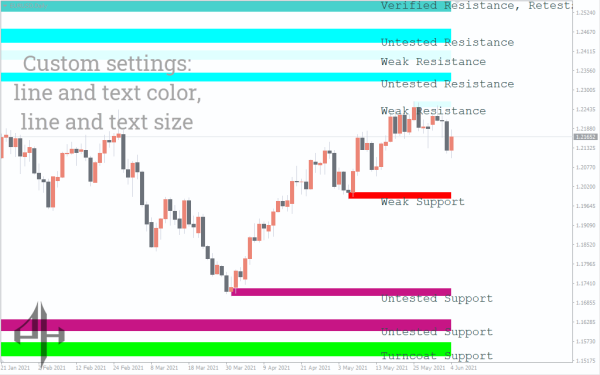
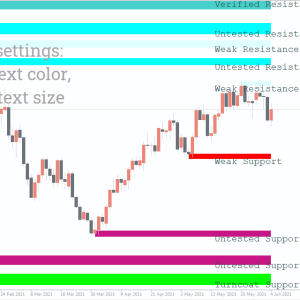
No need to worry about misinterpreting the highlighted level; each chart formation is conveniently accompanied with a brief textual description.
On longer periods, Shved Supply & Demand Indicator, like the majority of Forex market indicators, provides more reliable signals. This is due to the fact that short timeframes are characterised by a great deal of market noise.
The frequency with which prices have tested supply and demand zones is an additional factor that might make these zones more realistic.
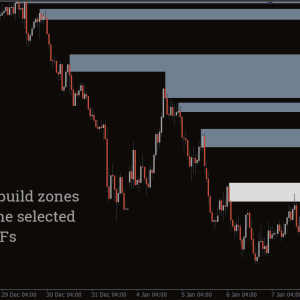
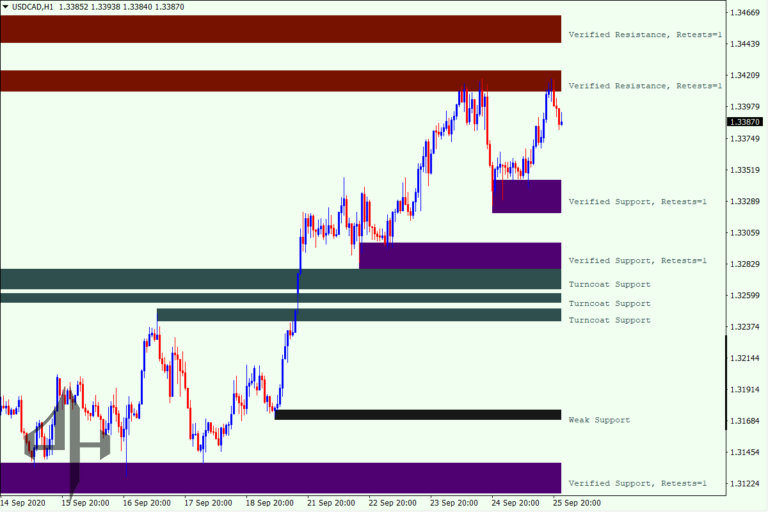
2. How does the Shved Supply & Demand Indicator plot zones?
Shved Supply & Demand Indicator identifies five distinct types of levels:
-
Weak Zone
These areas exhibit little to no significant supply or demand. Since there’s minimal market interest, it’s best to avoid trading around these zones or approach them with caution. -
Untested Zone
These are supply or demand zones that have previously triggered a strong, directional price move but have not yet been revisited or retested by the market. -
Verified Zone
These levels have been tested two or more times, indicating sustained interest from traders. The indicator shows the number of retests, with a higher count reflecting a stronger zone. -
Proven Zone
These are robust, repeatedly tested levels where trading activity regularly resumes. They are significant enough to often trigger trend continuations or reversals upon breakout. -
Turncoat Zone
Also called “mirror” levels, these zones originally act as support or resistance. Once broken, they frequently reverse roles due to shifting supply and demand dynamics, becoming key levels in the opposite direction.
3. Some real-world applications of the Shved Supply & Demand Indicator
You can use the indication in two ways: either going with the main trend or waiting for it to turn around to do the opposite.
Buying and selling when a trend shifts:
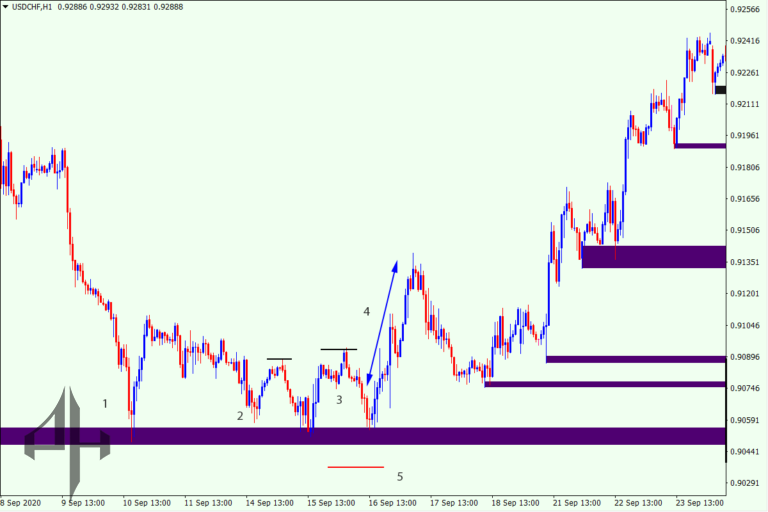
A reversal of fortunes is depicted in the preceding graphic. Now we’ll take a closer look at the idea behind this example’s indication use:
1 – the initial upswing in price. Due to increasing demand from players in the Forex market, the price has risen. The zone will be marked as “Untested” once this movement is complete.
2 – the second upward momentum movement occurs when the price approaches the level. Buyer interest in the chart formation is growing as it approaches “Verified” status.
3 – the uptrend may be able to keep going since the third wave of the rally reaches a new high. To be considered “Proven,” a level must have three distinct waves of price movement.
4 – We can search for Buy entry ideas the following time a new bullish movement accompanies the price as it approaches the zone.
5 – this is the correct spot for a temporary stop-loss order.
Trading with the main trend
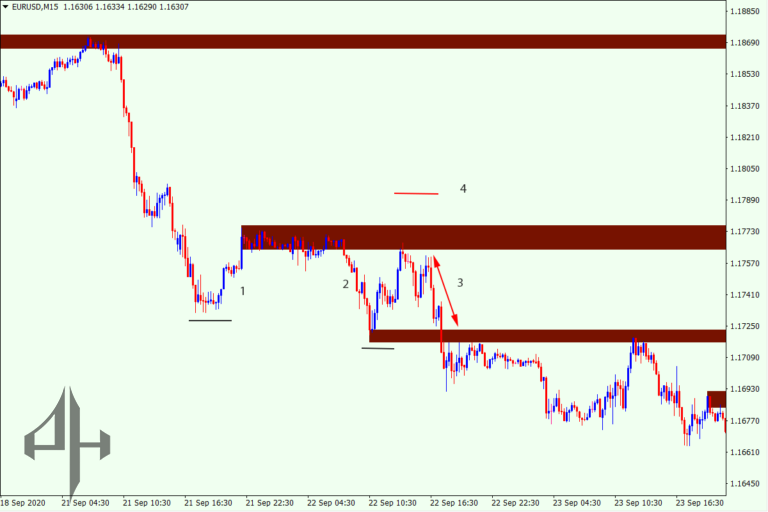
Here, a decline with waves of retracement and rallying is visible.
Similar to trading during a trend change, the principle of trading towards a trend is:
1 – the recent upswing represents a retracement of the main sell trend.
2 – Selling pressure is increasing when the first wave of declines moves below the previous low. The next time the price is near this level, you can search for opportunities to sell.
3 – We can now search for entry positions to sell at the market price during the second wave of sell-off, which starts at the level.
4 – is the recommended level to place a pending stop loss order.
While this indicator does a good job of highlighting the zones that traders in the Forex market should be paying attention to, it can be much more effective when used in conjunction with other trading tools.
Your chances of making good trades in the Forex market will rise if you use the Shved Supply and Demand Indicator in conjunction with other indicators or with indicator-free trading strategies (price action and candlestick patterns).
The Shved Supply & Demand Indicator can be a useful addition to any trading strategy you decide to use in the end. The idea is that there will be a significant increase in the likelihood of restarting movement from the trading activity levels that the indicator depicts.
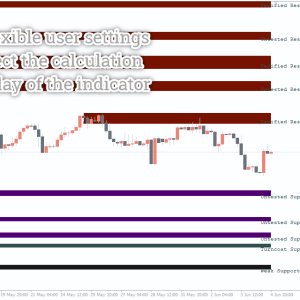
The following parameters are part of the indicator’s settings:
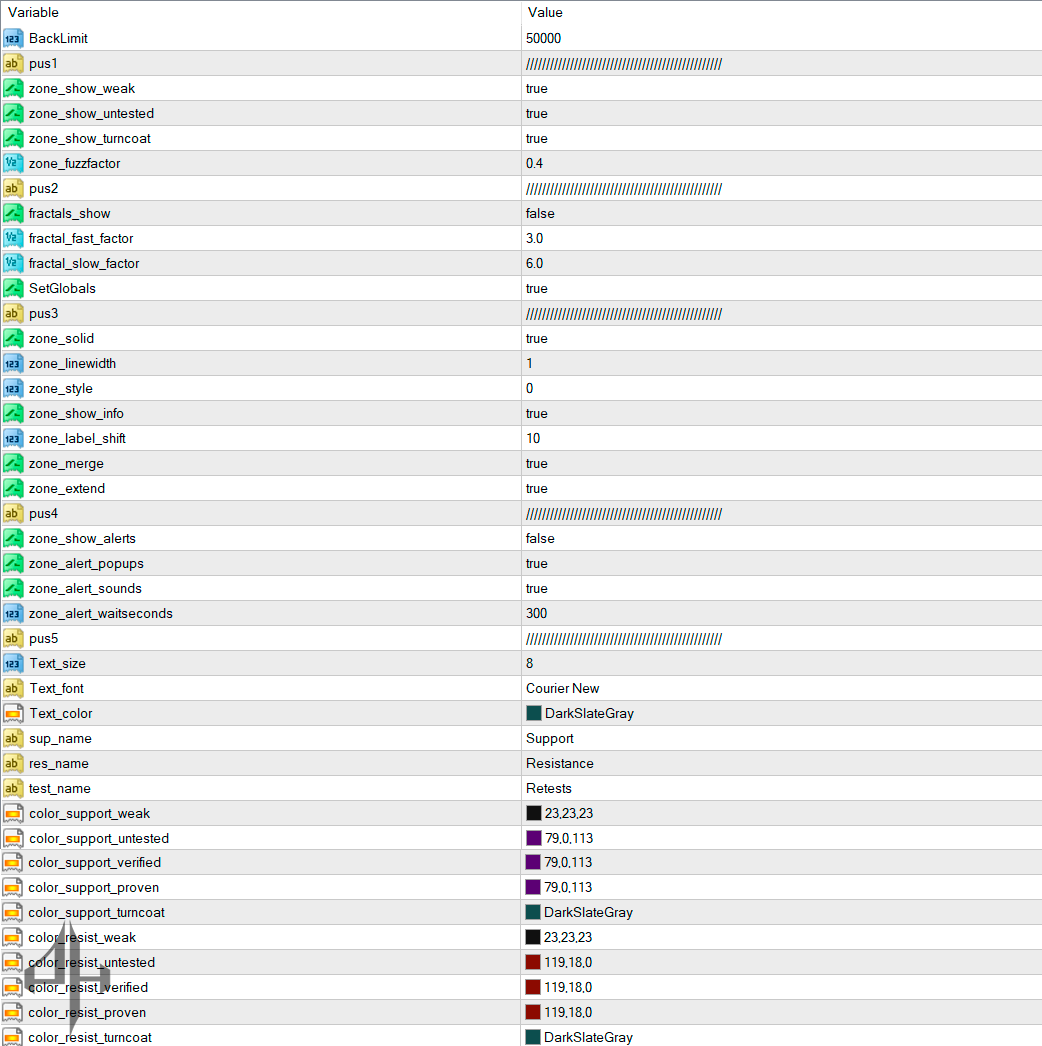
Indicator Settings Overview
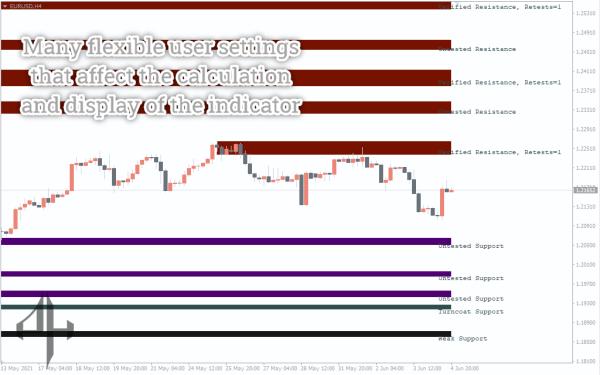
When you first apply the indicator, it automatically plots all detected supply and demand zones on the chart. While the initial display might seem overwhelming, fine-tuning the settings will help tailor the indicator to your trading style—making the information more actionable and intuitive.
General Settings
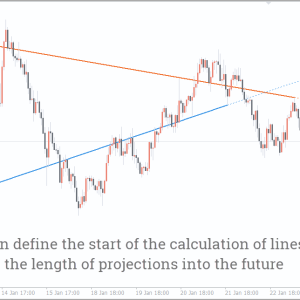
- Back Limit – Determines the number of candlesticks used to calculate and display the indicator’s zones.
Pus 1 – Zone Visibility & Appearance
- Zone Show Weak – Toggles the visibility of weak zones.
- Zone Show Untested – Toggles the visibility of untested zones.
- Zone Show Turncoat – Toggles the visibility of “turncoat” (mirror) zones.
- Zone Fuzz Factor – Adjusts the vertical size (height) of the supply and demand zones.
Pus 2 – Fractals Settings
- Fractals Show – Enables or disables the display of fractal points.
- Fractal Fast Factor – Sets the sensitivity for the fractal detection algorithm (faster response).
- Fractal Slow Factor – Sets the slower sensitivity level for the fractal detection algorithm.
Pus 3 – Zone Styling & Info
- Zone Solid – Sets the thickness of the zone areas.
- Zone Line Width – Adjusts the thickness of the zone borders.
- Zone Style – Defines the line style used for the price zones.
- Zone Show Info – Enables or disables the text labels for each zone.
- Zone Label Shift – Controls the position offset of the zone labels relative to the levels.
- Zone Merge – Allows merging of overlapping levels into one.
- Zone Extend – Enables the extension of nearby zones into a single combined area.
Pus 4 – Alerts & Notifications
- Zone Show Alerts – Activates alerts when the price nears a zone.
- Zone Alert Popups – Enables pop-up messages when price reaches specific levels.
- Zone Alert Sounds – Activates sound notifications.
- Zone Alert Wait Seconds – Sets the delay between alert notifications.
Pus 5 – Text & Color Customization
- Text Size – Adjusts the size of text labels.
- Text Font – Selects the font used in zone descriptions.
- Text Color – Sets the color of the text labels.
Zone Naming:
- Sup Name – Custom name for support zones.
- Res Name – Custom name for resistance zones.
- Test Name – Custom name for retested levels.
Color Settings:
- Support Zones:
- Weak – Color for weak support zones.
- Untested – Color for untested support zones.
- Verified – Color for tested support zones.
- Proven – Color for repeatedly tested support zones.
- Turncoat – Color for turncoat (mirror) support zones.
- Resistance Zones:
- Weak – Color for weak resistance levels.
- Untested – Color for untested resistance levels.
- Verified – Color for tested resistance levels.
- Proven – Color for repeatedly tested resistance levels.
- Turncoat – Color for turncoat (mirror) resistance levels.