
- Description
- Indicator Settings
Description
You have probably seen on numerous occasions that the high volatility of the Forex market makes it hard to tell the difference between trend and retracement waves.
A free Fibonacci Retracement indicator was created in order to address this issue. You can read this article to learn more.
Contents:
1. Description of the indicator Fibonacci Retracement Indicator
2. The Fibonacci levels are described
3. How to use the Fibonacci Retracement Indicator
1. Description of the indicator Fibonacci Retracement Indicator
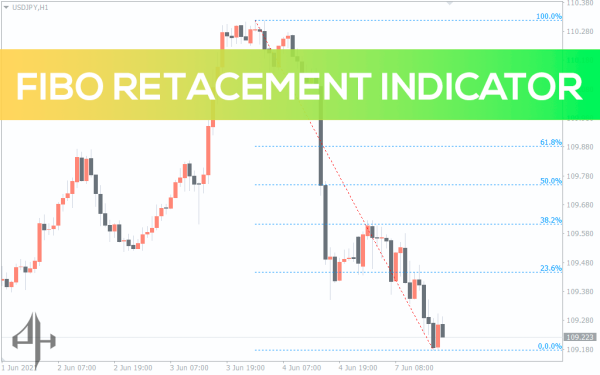
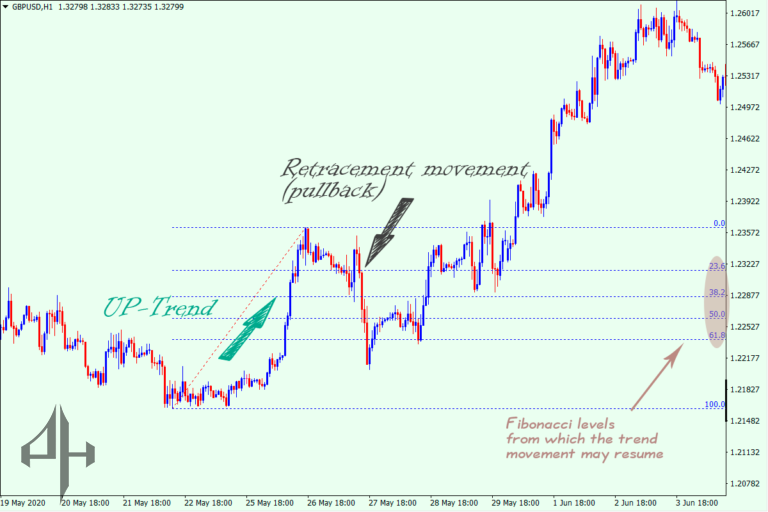
On the MT4 chart, the indicator automatically displays the Fibonacci levels, also known as the Fibo extensions. By doing this, it ignores the “flat market” phase and only considers the periods of active price movement.
The Fibo extensions aid in estimating the potential pullback or retracement depth in respect to the main trend. You can identify the pivot points (or pivots) from which the main trend is most likely to resume by using the levels.
The Fibo levels are based on the idea that pivot points towards the dominant trend are more likely to occur the deeper the decline.
2. The Fibonacci levels are described
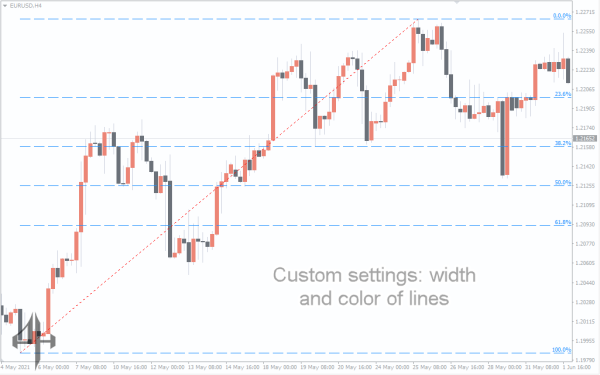
Fibonacci Retracement Indicator extensions are computed as follows and displayed as percentages: Set the percentage values of 23.6, 38.2, 50.0, and 61.8 to be displayed on the Fibo grid, which is represented by values ranging from 0% to 100%. The Fibonacci levels (number 6) are drawn using the resultant values:
The starting point for the placement of the Fibonacci Retracement Indicator levels is 100%.
The so-called “golden ratio” is 61.8%. The 50% value is well complement by this level. Therefore, a pivot point is more likely to occur if the pullback wave slows down around these two levels.
50% is where pivots frequently form. This is because, following trading pullbacks, short-term traders lock in profits on their positions.
38.2%: When traders are very active and self-assured, pivots emerge near this level.
Only infrequently do pivots emerge around 23.6%. In order to find entry positions, forex market participants frequently wait for a deeper retracement.
0% is the value at which the Fibo levels placement ends.
The 78.6% level is seen when utilising the Fibonacci levels in other indicators. Pullback waves typically fall short of this threshold. This can be explained by the trend movement’s earlier recovery, which occurs adjacent to the higher levels. For this reason, the FiboRetracement indicator’s 78.6% extension level was eliminated.
You should consider each particular scenario on the chart in addition to the theoretical explanation of the levels. Therefore, there is a greater possibility of the trend continuing if there was a strong trend before to the retracement and the pullback wave is moderate.
On the other hand, the retreat will probably become a new, opposing trend if it is greater than the main trend.
Additionally, there is a greater probability of recovering the main trend if the Fibonacci Retracement Indicator line up with round-number levels (check out the free RoundLevels indicator) or other technical analysis tools.
3. How to use the Fibonacci Retracement Indicator
In addition to other indicators, we advise using the Fibonacci Retracement Indicator into your trading strategy. The likelihood of a successful trading outcome increases with the number of indications that indicate it is time to open a deal.
As an extra trading indicator, let’s employ the trendline, one of the fundamental instruments of technical analysis. We must download the AutoTrendLines indicator for free in order to accomplish this.
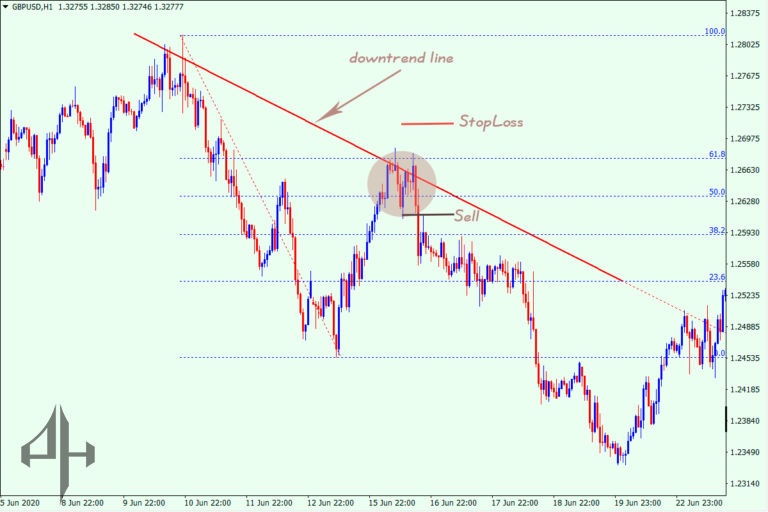
The accompanying chart shows that the pullback wave has ceased to grow near the Fibo levels of 50.0% and 61.8%. This could mark the start of a selling campaign and the first sign of a turning moment.
The trendline serves as a secondary signal in this instance, indicating that the likelihood of the decline restarting near it is minimal.
Finding the pivot points is crucial when the downward trend resumes; it would be safer to place the Stop Loss above the trendline.
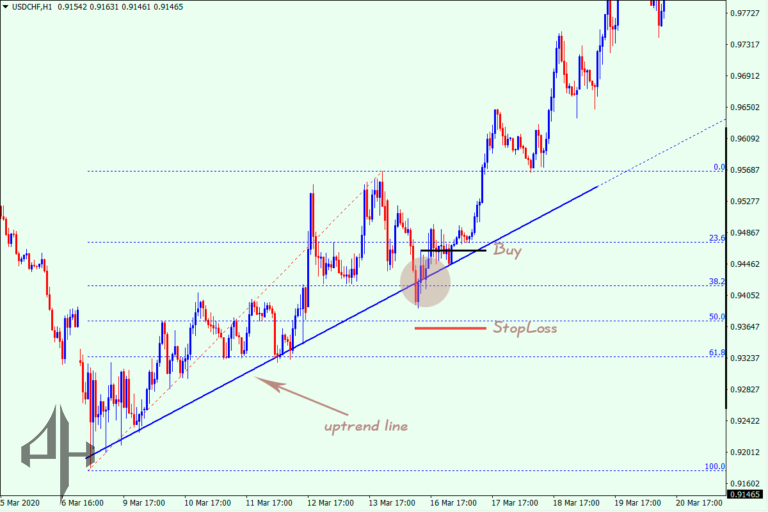
Similar to selling, the trendline on this chart shows a bullish trend and serves as an extra tool.
The retreat action has just hit the 38.2% Fibo level, in contrast to selling. This implies that traders in the Forex market are upbeat and frequently execute buy trades.
You can start a trade at the market price in this situation, and your stop loss should set above the support line.
The levels of the indicator won’t be repaint when you change timeframes. Double-clicking the indication and deleting it will fix this flaw. The indicator will then operate in automatic mode for the duration you have chosen.
The primary benefit of the indicator’s levels is their practicality. The indicator will be helpful in identifying strong pivots following pullbacks, regardless of the time frame you trade on and the trading strategy you employ (long-term, intraday, or scalping).
The Fibonacci Retracement Indicator levels can also be use to see how the Forex market is feeling overall. And with that knowledge, you’ll probably be able to forecast the price’s next move.
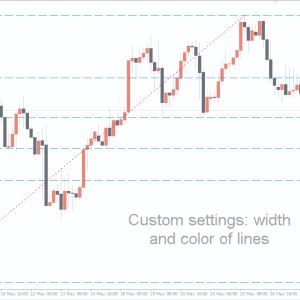
The following parameters are available for selection in the indicator’s settings:
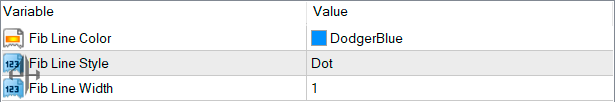
Fib Line Colour – lets you chose the Fibonacci levels’ colour.
Fib Line Style – helps you to choose the kind of lines showing the Fibo levels.
Fib Line Width – enables you to choose the level thickness.