- Description
- Indicator Settings
Description
The Auto Fibo Indicator tool delineates the retracement levels ranging from 0% to 100%. A Fibonacci retracement is a useful tool for technical analysis. Do not worry if you are unfamiliar with Fibonacci retracement. In essence, the tool makes use of the Fibonacci sequence, which consists of the numbers 0, 1, 1, 2, 3, 5, 8, 13, and so forth. The Fibonacci ratios are obtained by dividing the Fibonacci numbers by the neighbouring numbers. These ratios are plotted on the price chart using the Fibonacci retracement tool.
In essence, before you plot the indicator, you must determine the chart’s highs and lows. Plotting the chart and really determining the highs can be difficult. It goes without saying that you are prone to errors, particularly if you are unfamiliar with the indication.
Fortunately, the Auto Fibo Indicator indicator for MT5 is available for free download. The indicator automatically plots itself on the chart, as the name suggests. It tells you the chart’s peak and low points. This implies that setting the two points explicitly is not necessary.
The auto Fibonacci indicator’s greatest feature is its compatibility with all time periods and currency pairs.
The working mechanism of the Auto Fibo Indicator
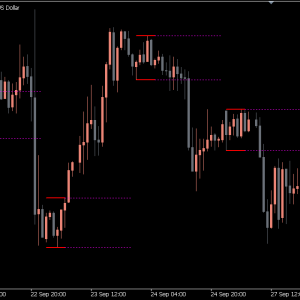
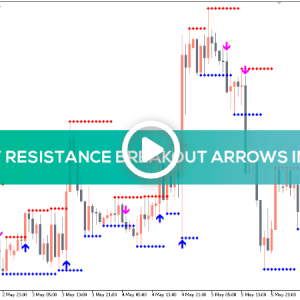
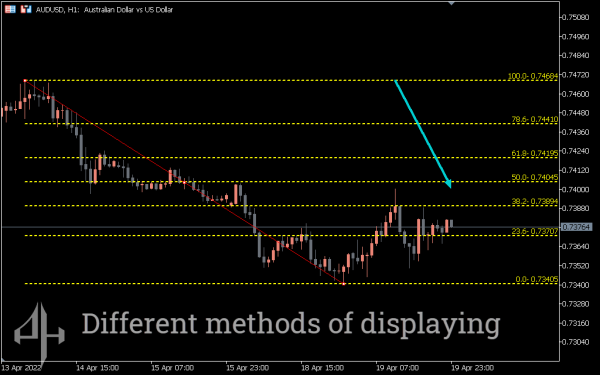
The retracement levels are plotted by the Auto Fibo Indicator between 0% and 100%. The zero is at the top and the 100 is at the bottom if the market is bearish, and vice versa. In essence, the market tends to retrace up to the different Fibonacci retracement levels after hitting a new high.
Assume that an upward trend is anticipated to retrace up to the Fibonacci level of 38.2%. All you have to do is wait for the market to recover to 38.2% and then buy. The stop loss might be set below 50% of the Fibonacci level or below the swing low. You can set the take-profit for the exit strategy at the subsequent high or resistance level.
The price frequently rises to the 50% Fibonacci level. However, because it offers a significant retreat, 61.8% is preferred by most traders. Although it is often disregarded, the 78.6% level also offers a great reversal moment.
When riding the trend, the Fibonacci levels provide excellent take-profit levels in addition to trading pullbacks. For example, you can initiate a short position with a take-profit at the 68.1% level if an uptrend is reversing.
A Chart Example Auto Fibo Indicator
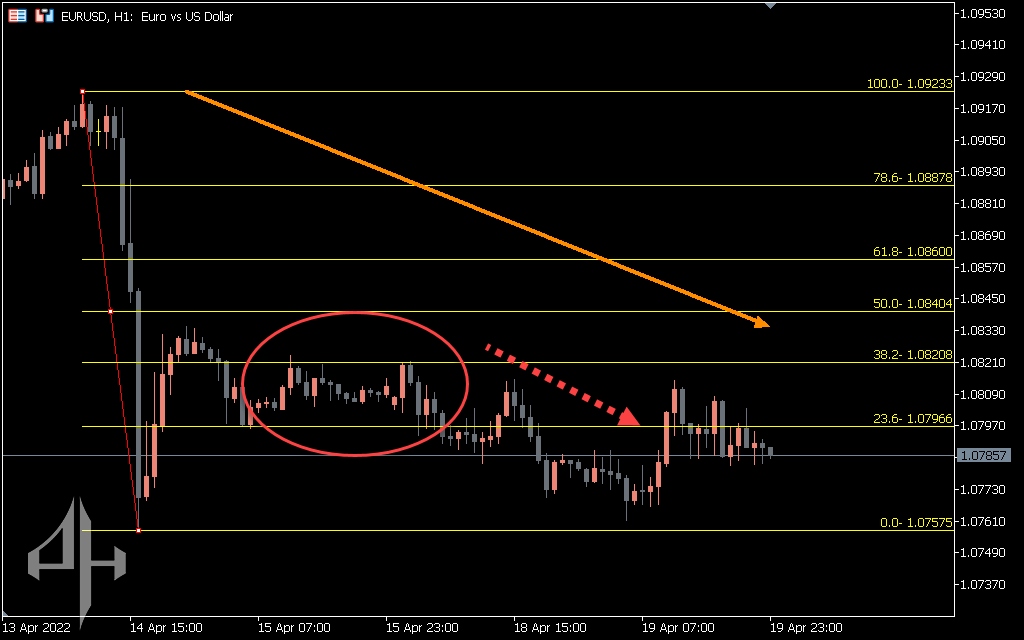
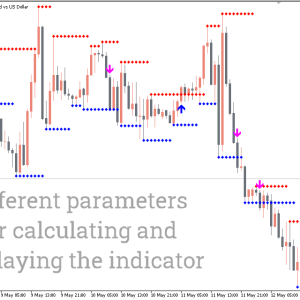
The price movement of the US dollar relative to the euro during a one-hour period is displayed in the above chart. The price retracement of the currency pair surpasses the 23.6% and 38.2% marks. But after hitting 23.6%, the price retreats to 38.2% before continuing its downward trajectory.
You can use a stop loss above the most recent swing high to enter a downtrend, depending on your trading analysis. The next support zone and the 23.6% or 0% Fibonacci levels are the best times to exit the market. Fibonacci expansion is another strategy used by some traders to make money.
Conclusion
Technical traders can easily plot the Fibonacci levels with the help of the Auto Fibo Indicator. The entry and exit signals are not provided by the indicator alone. Nonetheless, the Fibonacci levels offer great places to enter and exit the market. In order to establish confluence, it is therefore recommended to use the indicator in conjunction with additional techniques.
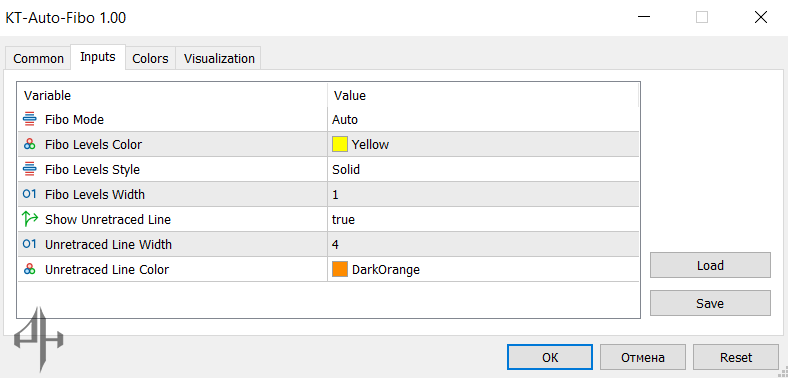
Fibo Mode: Allows you to manually set Fibonacci levels. By default, the indicator operates in automatic mode.
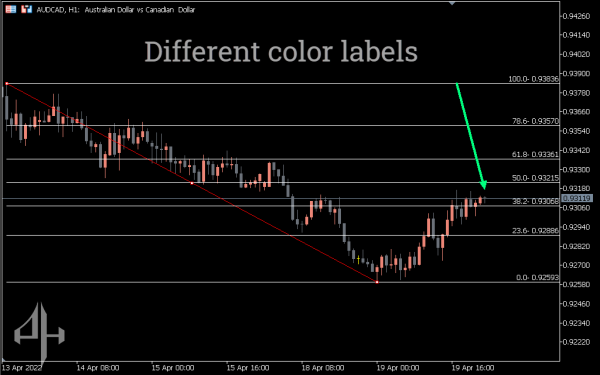
Fibo Levels Color: Sets the color of the Fibonacci levels; the default is yellow.
Fibo Levels Width: Adjusts the thickness of the Fibonacci lines.
Fibo Levels Style: Lets you choose the line style for Fibonacci levels, such as solid or dotted.
Show Unretraced Line: Toggles the display of the potential retracement zone. Set to true to show the zone, or false to hide it.
Unretraced Line Width: Specifies the thickness of the retracement zone lines.
Unretraced Line Color: Sets the color of the retracement zone; the default is DarkOrange.