
- Description
- Reviews (0)
- Indicator Settings
Description
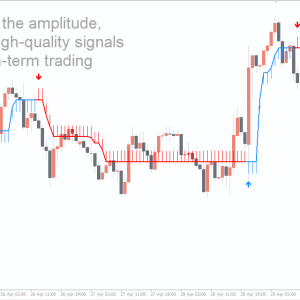
The three-point pattern at the end of the trend is specified by the 1-2-3 Pattern indicator for MT4. The indicator uses three points to plot a zigzag pattern. These lines or points are Fib, entry, and high/low. It is known as the 1-2-3 pattern for this reason.
With this non-painting zigzag pattern, the Fibonacci levels add up to identify five Fibonacci levels.
The non-repainting zigzag pattern of three lines and these Fibonacci levels are used to identify price movement. Because it can depict price action tendencies, the indicator is often helpful for price action methods.
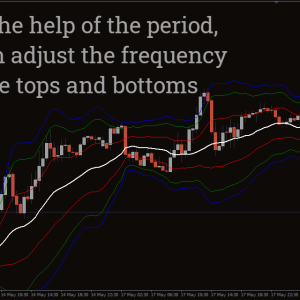
You can adjust your positions in accordance with the support and resistance provided by the five Fib levels. The 1-2-3 Pattern indication can be used on any timescale, although it works best on a 5- to 30-minute timeframe.
How to trade with the 1-2-3 pattern indicator
The price action at the end of the trend is identified by the 1-2-3 Pattern indicator. The indicator provides you with entry and exit indications using Fibonacci levels and non-repainting zigzag lines.
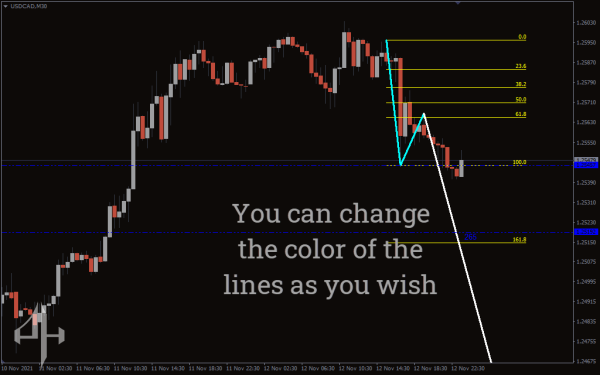
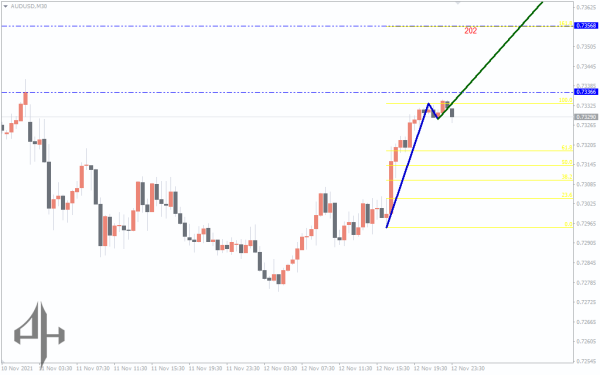
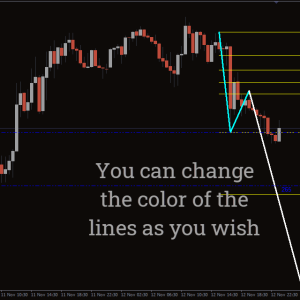
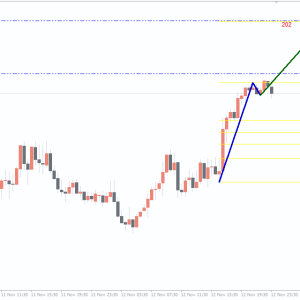
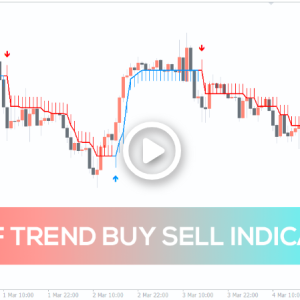
The indicator will display a green line indicating buy signals when the market is rising. On the other hand, this indicator will display a blue line, signifying a sell signal, when the market is in a downward trend.
The five Fibonacci levels serve as resistance and support. The higher pone level acts as resistance, while the lower Fib level acts as support.
The indicator turns from green to red, or vice versa, when the trend shifts direction. You can therefore close the trade. When the price action moves above or below the line, you can also pull out of the transaction.
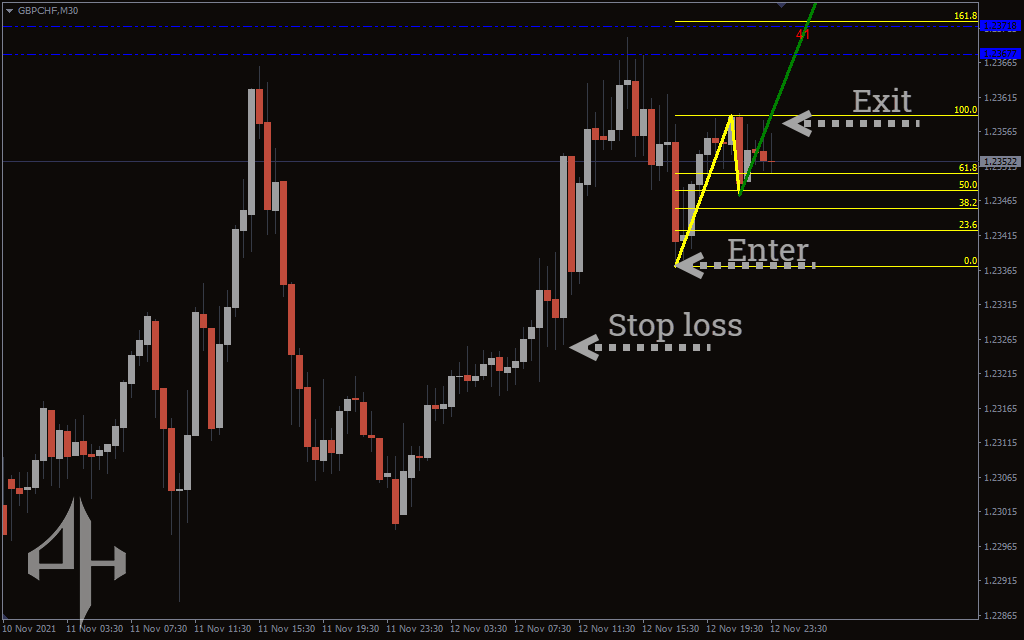
1-2-3 Pattern Indicator – buy Setup
- The indicator ought to point to an upward trend.
- Await the trend’s complete development.
- Where the indication starts, enter the trade.
- Set a stop-loss close to the purchase point’s low.
- When the price falls below the line, exit the trade.
1-2-3 Pattern Indicator – Sell Setup
-
Ensure the indicator confirms a downtrend.
-
Wait until the downtrend is clearly established.
-
Enter the trade at the point where the pattern initiates.
-
Set a stop-loss just above the recent high (point of the sell signal).
-
Close the position if the price moves above the designated breakout line.

Conclusion
The 1-2-3 Pattern indicator gives you the trends in price activity and identifies entry and exit places. The indicator can display levels of support and resistance thanks to the Fib levels.
Be the first to review “1-2-3 Pattern Indicator, Explosive Trade Setups”
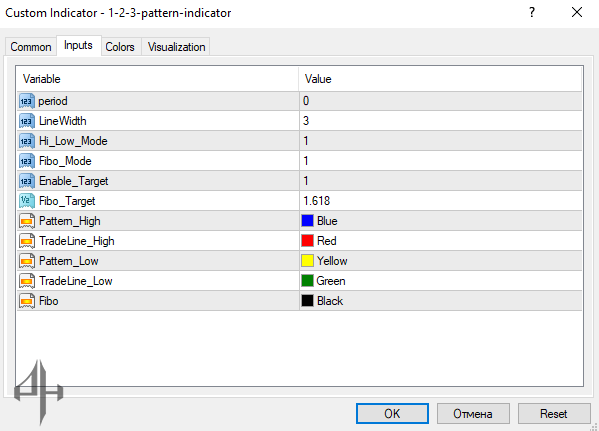
Period: Default is 0. Specifies the time period used by the indicator.
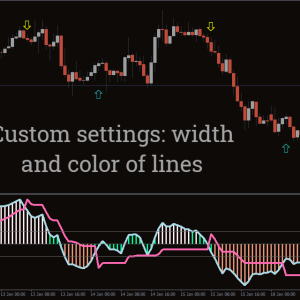
Line Width: Default is 3. Determines the thickness of the three plotted lines.
High_Low_Mode: Default is 1. Defines the display mode for high and low lines.
Fibo_Mode: Default is 1. Specifies the configuration mode for Fibonacci lines.
Enable_Target: Default is 1. Activates the target line for the defined period.
Fibo_Target: Default is 1.618. Sets the Fibonacci level used for target projection.
Pattern_High: Sets the color used to highlight price highs.
TradeLine_High: Defines the color of the high trade line.
Pattern_Low: Sets the color used to mark price lows.
TradeLine_Low: Defines the color of the low trade line.
Fibo: Specifies the color of the Fibonacci line.
Reviews
There are no reviews yet.