
- Description
- Reviews (0)
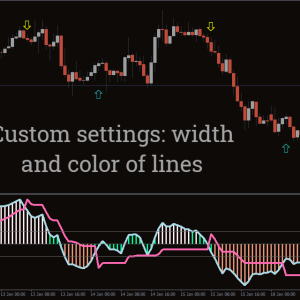
- Indicator Settings
Description
If you’re having trouble with Japanese candlesticks, the Heiken Ashi Indicator can help. The most popular and favored chart for technical analysis is the Japanese candlestick, one of the three charting methods used in forex. In addition to displaying each bar’s open, high, low, and close, the candlestick also reveals whether the candle is bullish or bearish. This chart is the most popular, but because there are so many noises in the market, it is prone to many false signals. The Heiken Ashi Indicator is used to rectify the challenges associated with employing Japanese candlesticks.
Foundation
A Japanese candlestick known as the Heiken Ashi Indicator is smoother than a regular candlestick since it averages the two periods.
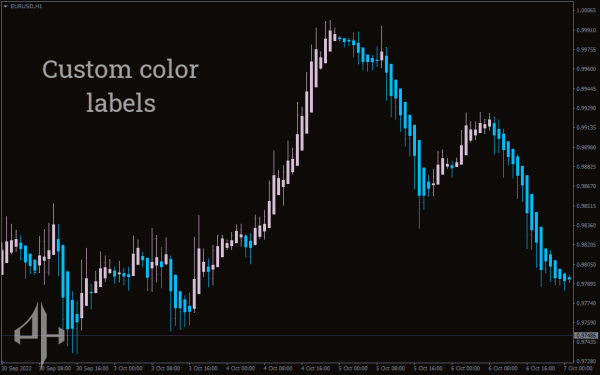
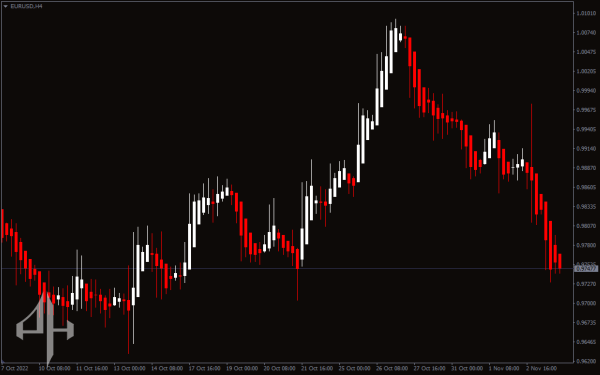
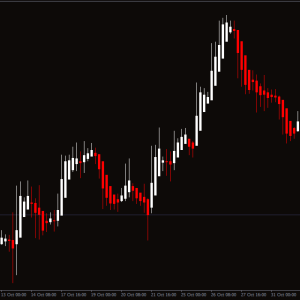
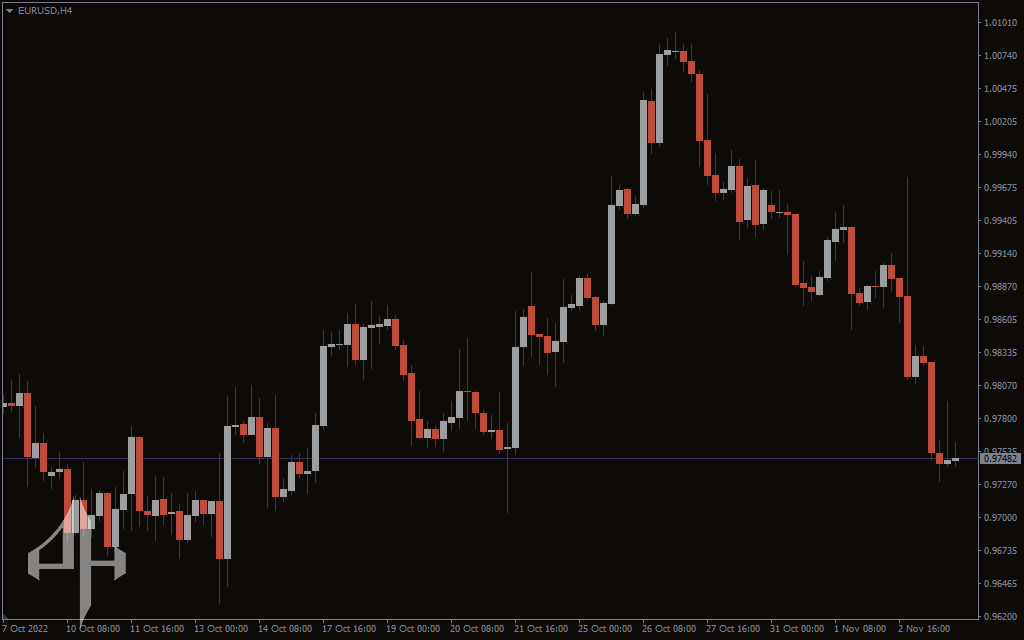
The EUR/USD H4 of two distinct charts is displayed in the figures below:
- the Heiken Ashi Indicator

- The typical Japanese candlestick
The typical Japanese candlestick charts, as seen in the two pictures above, can be challenging to understand because they regularly shift from red to green.
Candles on the Heiken Ashi chart, on the other hand, exhibit more consistent colors, remaining green during an upswing and red during a downtrend.
It is simpler to identify trends and trend reversals when the indicator smoothes out charts and eliminates market noise.
Using this indicator to identify trends and trend reversals aids traders in deciding whether to stay in a position or leave the market.
To ride a trend for a long period and to leave the market when the trend weakens, the Heiken Ashi Indicator is especially useful.
How to Use The Heiken Ashi Indicator
Technical traders use the Heiken Ashi Indicator to spot trends.
A Heiken Ashi indicator with red candles indicates a downward trend. In contrast, as shown in the image below, green candles suggest an upward tendency.
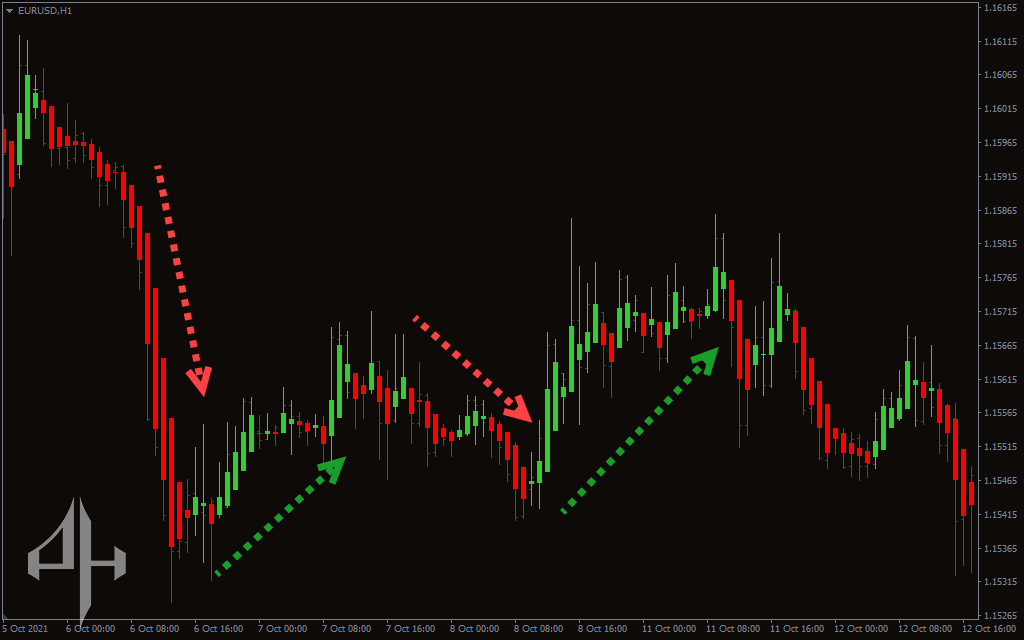
Additionally, the trend strength can be determined by looking at the indicator candles’ wicks.
A strong rise is indicated by bull candles with no lower wick.
Additionally, bear candles in a downtrend that have no upper wick indicate that the downturn is strong.
Short trades can be opened and long positions should be closed when the Heiken Ashi Indicator candle turns red from green, indicating the beginning of a downtrend.
As a result, when the indicator candle turns green from red, it indicates the beginning of an uptrend; long trades are advised and short trades should be closed.
Like regular Japanese candlesticks, the Heiken Ashi Indicator candles can also be used to block reversal indications like dojis and spinning tops.
Conclusion
The Heiken Ashi Indicator works best for identifying and maintaining a trend over time. The indicator is therefore most appropriate for trend traders.
Additionally, in a sideways or choppy market, this indicator assists traders avoid entering the market by reducing erroneous trading signals.
Because these indicator candles take longer to react, scalpers and intraday traders shouldn’t use them.
For long-term trend riding, the indicator works best for swing and position trading.
Be the first to review “Heiken Ashi Indicator, Boost Your Trading Clarity”
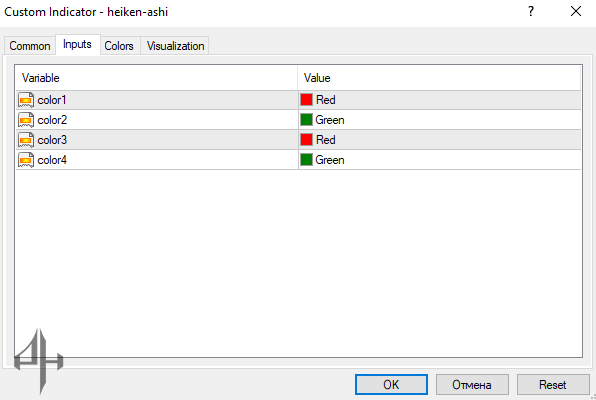
The Heiken Ashi Indicator in MT4 includes the following color settings:
Color 1: Represents the bearish candle color on the main chart.
Color 2: Represents the bullish candle color on the main chart.
Color 3: Sets the bearish candle color for the Heiken Ashi indicator.
Color 4: Sets the bullish candle color for the Heiken Ashi indicator.

Reviews
There are no reviews yet.