

- Description
- Reviews (0)
- Indicator Settings
Description
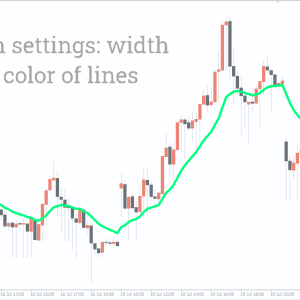
One of the useful tools for forex traders is the moving average (MA). They display pricing variations over time. The EMA Indicator is one of four forms of MA, it should be noted. The latest prices are given more weight by exponential moving averages (EMA). This indicates that compared to simple moving averages, it responds more to recent price movements. Furthermore, the MT4-free download’s EMA indicator notices price fluctuations early enough. But in a short period of time, it undergoes more alterations.
Using the EMA Indicator for Trading
The EMA indicator can be used in a variety of ways.
In general, a rising EMA Indicator a bull market, whereas a dropping EMA shows a bearish trend in prices. Accordingly, you should aim to go long when the EMA is rising and open sell positions when it is falling.
To determine the overall market trend, you should also consider the EMA’s position. An obvious indication of an ongoing uptrend is when the price trend crosses above the exponential moving average line. Similarly, a decline in the market is indicated if the price is below the EMA line.
Crossover Strategy
Better buy and sell signals are provided by the Crossover technique. Fast and slow EMA Indicator periods, usually 9 and 21 periods EMA, are ideal for this method.
When the shorter EMA crosses the longer period EMA from below, a buy signal is produced. Likewise, it is considered a sell signal when the shorter EMA crosses the longer EMA from above.
Now, you wonder, what is the exit strategy? The indication can be placed at the most recent low, and a profit can be placed at the next resistance or high zone.
Triple EMA strategy
Using triple EMA improves the indication. To produce better signals, three distinct periods are used. You may decide to employ the 5, 15, and 200 EMA periods, for example. The price should be trading above the 200 EMA line in order to receive purchase signals. Next, wait for the 15 EMA line to be inserted by the 5 EMA.
An Example Chart
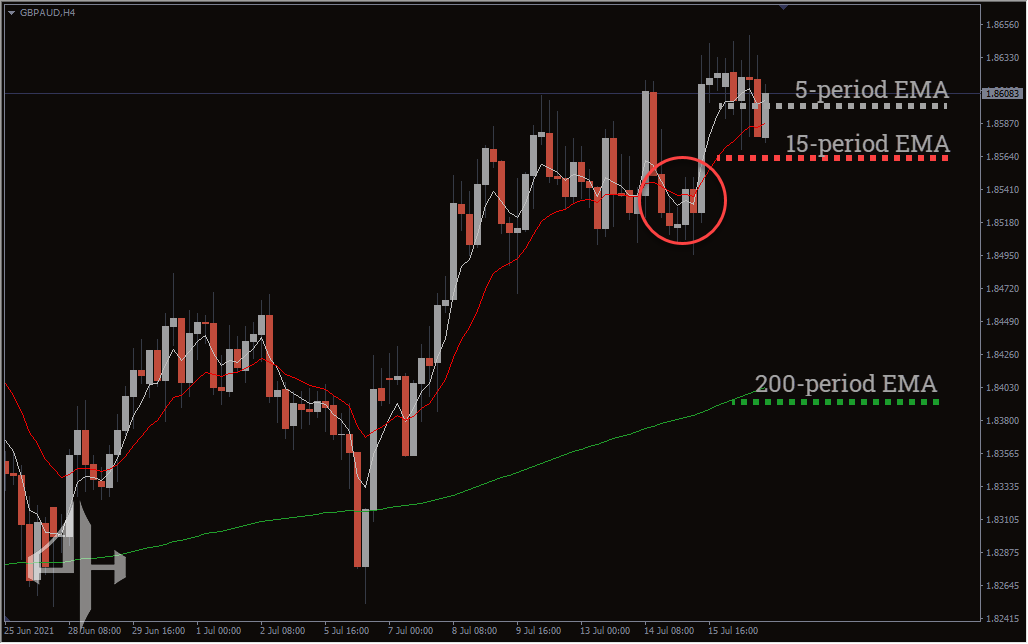
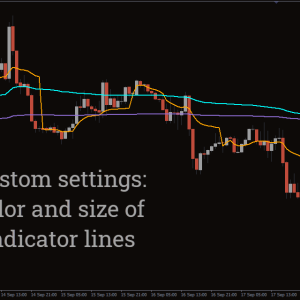
A pricing chart for the British pound in relation to the Australian dollar is displayed in the image above. The 5-period EMA is represented by the blue line that the grey arrow displays. The 200-period EMA is shown by the green line, while the 15-period EMA is shown by the red line.
The price is trading above the 200-period EMA, as you can see. When the blue line crosses the red line, as indicated by the yellow circle, the indicator gives a purchase signal. After the signal, the price actually continued its upward path.
Just below the piercing pattern and below the current low is a fantastic stop loss. An excellent stop loss is also provided by the extended (200) period EMA. The 1:3 risk to reward ratio can be used as an exit strategy. Another good take-profit location is the next resistance area.
Conclusion
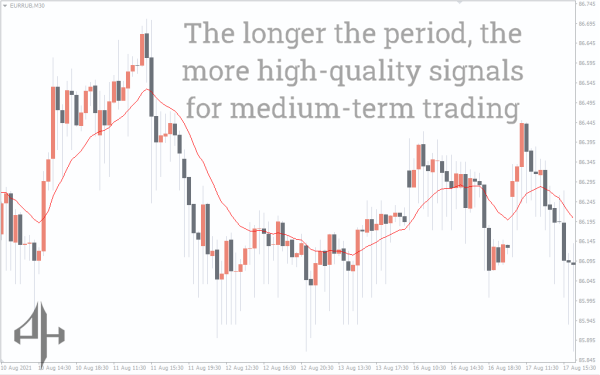
One excellent indicator is the EMA. Keep in mind that longer timeframes allow for more fluid market action. It generates more false signals, though. Conversely, shorter times result in more signals—albeit more false ones. To obtain more authentic indications, it is important to utilise the indicator in conjunction with other instruments.
Be the first to review “EMA Indicator, Ultimate EMA Indicator Guide”
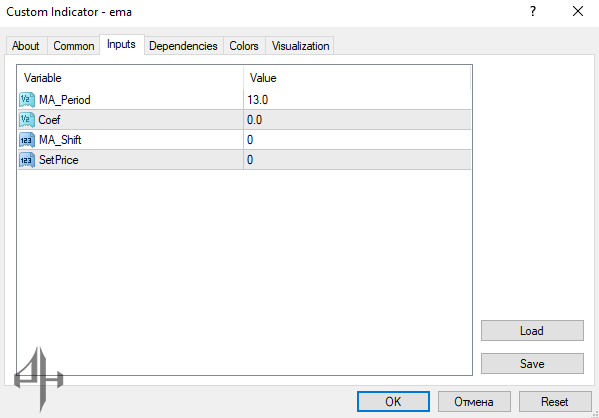
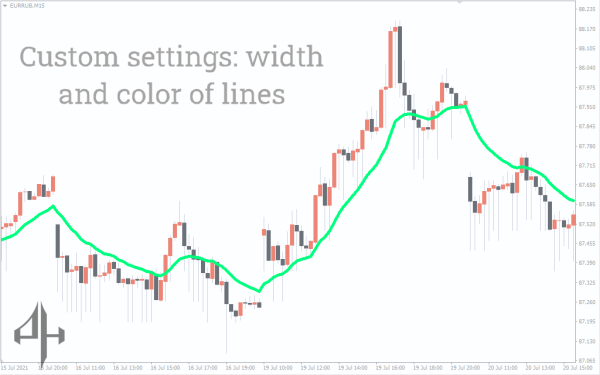
MA_Period: The number of candlesticks used to compute the moving average.
Coef: A coefficient applied in the moving average calculation.
MA_Shift: Lets traders shift the EMA indicator forward or backward on the chart.
SetPrice: Enables selection of the price type (close, open, high, or low) used in the indicator’s calculation.
Reviews
There are no reviews yet.