- Description
- Indicator Settings
Description
An automated horizontal support and resistance indicator built on MetaTrader 5 is called Fractal Support and Resistance Indicator. Strong support and resistance areas are highlighted by the fractal line, which aids intraday traders in identifying swing and breakout trading opportunities.
An alternative to pivot indicators is this one. The high, low, and close of the day are used to form reversal lines. Conversely, larger price highs and lower price lows characterize fractal points.
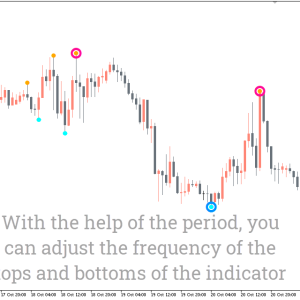
Typically, a fractal indicator indicates a potential trend reversal by drawing arrows frequently. Both horizontal and dynamic pricing channels can be found by manually joining these fractal arrows with straight lines. Fractal Support and Resistance Indicator is unique in that it automatically creates horizontal price channels by joining fractal points.
How to trade with the Fractal Support and Resistance Indicator MetaTrader
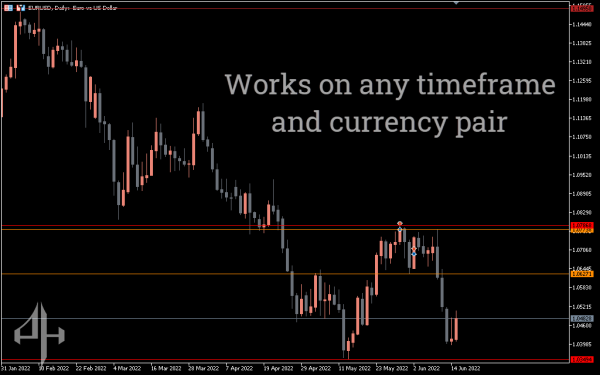
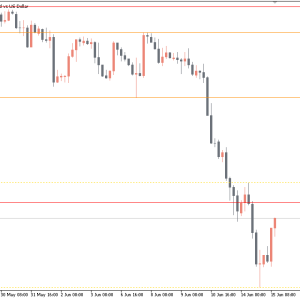
The effectiveness of autofractal channels in displaying strong support and resistance levels is demonstrated in the H1 EURUSD chart above.
Weekly levels of support and resistance are shown by the dotted fractal lines. Conversely, the primary areas of intraday market occurrences are highlighted by thick colored lines. The price will primarily fluctuate within the fractal channels, as the preceding chart illustrates. The price frequently bounces after hitting the support/resistance zone since the channel’s horizontal levels represent locations of significant occurrences.
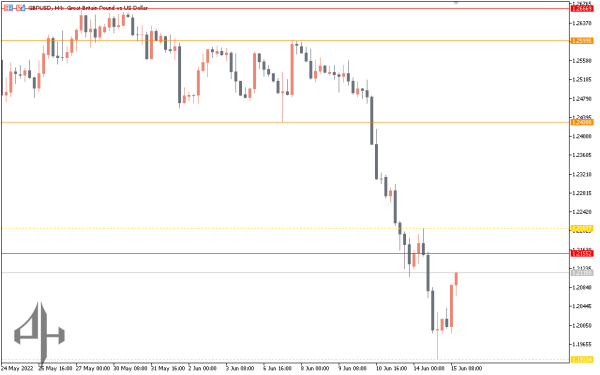
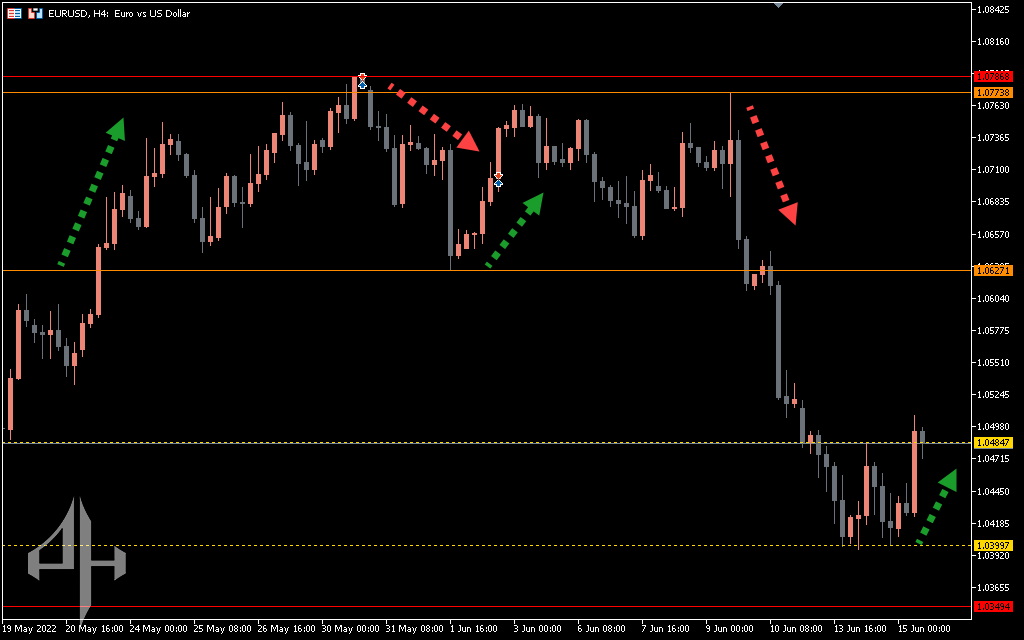
Therefore, look at the fsr lines’ positions first when you open an intraday chart. Secondly, monitor price positions in relation to fractal levels. For instance, it is important to seek a selling opportunity when price movement occurs just below fractal resistance.
He sprang back and began moving in the opposite way each time the price built a pin bar on the fractal lines, as you can see in the example above. Therefore, when a bullish pin bar is constructed on fractal support, we can initially concentrate on a buy order. On the other hand, the ideal indication to short is a bearish pin bar at fractal resistance.
There is a significant chance of a possible price breakout whenever the price breaks a fractal level. A price breakthrough over a fractal resistance line, for instance, indicates a bullish market. Wait until the price breaches the fractal support line, on the other hand, for a bearish breakout. Setting MT5 alerts close to fractal levels is what we advise. Every time the price reaches a significant market support and resistance zone, this will help you draw attention.
Conclusion
MTF indicator with Fractal Support and Resistance Indicator that doesn’t require redrawing. This indicates that following each price bar’s close, the fractal support and resistance levels remain in the same location. Additionally, fractal lines on multi-timeframe charts don’t change.
For forex swing traders, the fractal arrow is already a well-liked trading indicator. A further advantage for intraday traders on price action is the Fractal Support and Resistance Indicator. Both novice and seasoned traders can benefit greatly from this non-redrawing indication, which is appropriate for multi-timeframe charting.
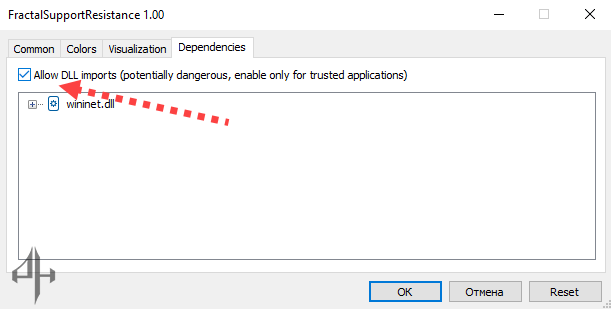
The indicator’s MT5 parameters cannot be changed significantly due to fractal support and resistance. However, confirm that the Dependencies tab’s “Allow DLL Imports” options are turned on. These characteristics guarantee that the indicator displays precise fractal levels and utilizes up-to-date data.