- Description
- Indicator Settings
Description
Do you trade price action but find it difficult to establish reliable patterns? The My Price Action indicator for MT4 takes care of this for you, so you can stop worrying. Let’s read this article to find out more about the indication.
My Price Action Indicator: What is it?
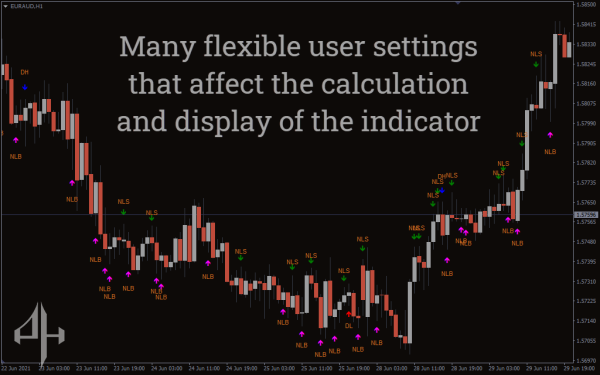
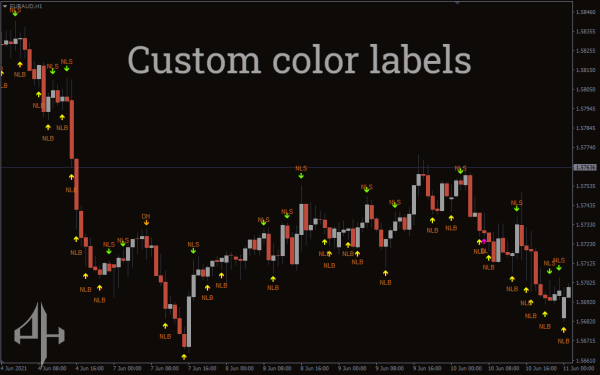
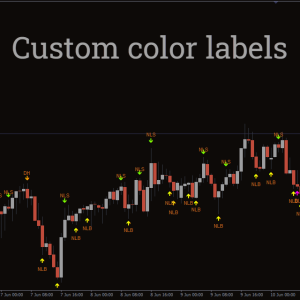
A bespoke indicator called My Price Action highlights key candlesticks where a big price shift can be anticipated. There are many signs on the indicator. It starts by indicating arrows either above or below the candlesticks. Certain price motion is also indicated by the color of the arrows.
The arrow signals, however, are not a stand-alone buying or selling signal. As a result, before utilizing the various indications in your trading, you could need to comprehend how they are interpreted.
How to use the My Price Action Indicator
The indicator’s fundamental idea is predicated on the candles’ shadows. When a candle has a shadow above or below it, you understand what it means. It makes it simpler for you to identify the pressure to purchase or sell at a certain moment.
For instance, you discover a lengthy shadow on the underside. It indicates a rise in purchasing pressure. In such a situation, you can search for a long opportunity.
Trading with My Price Action Indicator
Let’s now discuss the indicator’s trading approach.
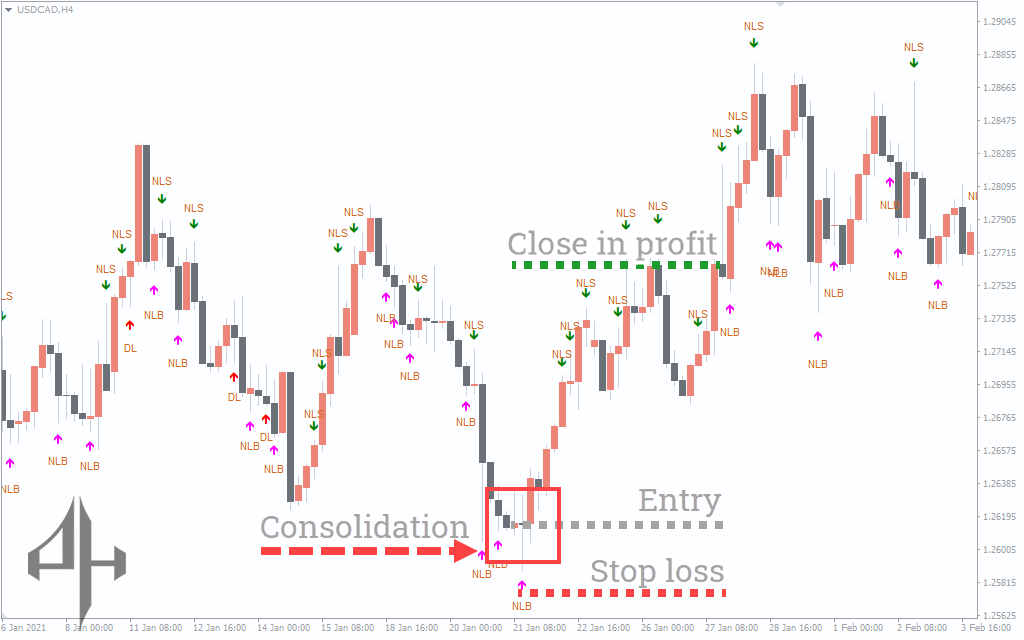
Buy Setup
-
Use a 4-hour timeframe.
-
Set hightwick1 to 50 and hightwick2 to 25.
-
Set lowtwick1 to 50 and lowtwick2 to 25.
-
Identify areas where the price consolidates.
-
Look for a candle marked with a pink arrow below it labeled NLB.
-
Enter a long position, placing a stop-loss below the candle’s shadow.
-
Close the position for a profit when a green arrow appears above the candle labeled NLS.
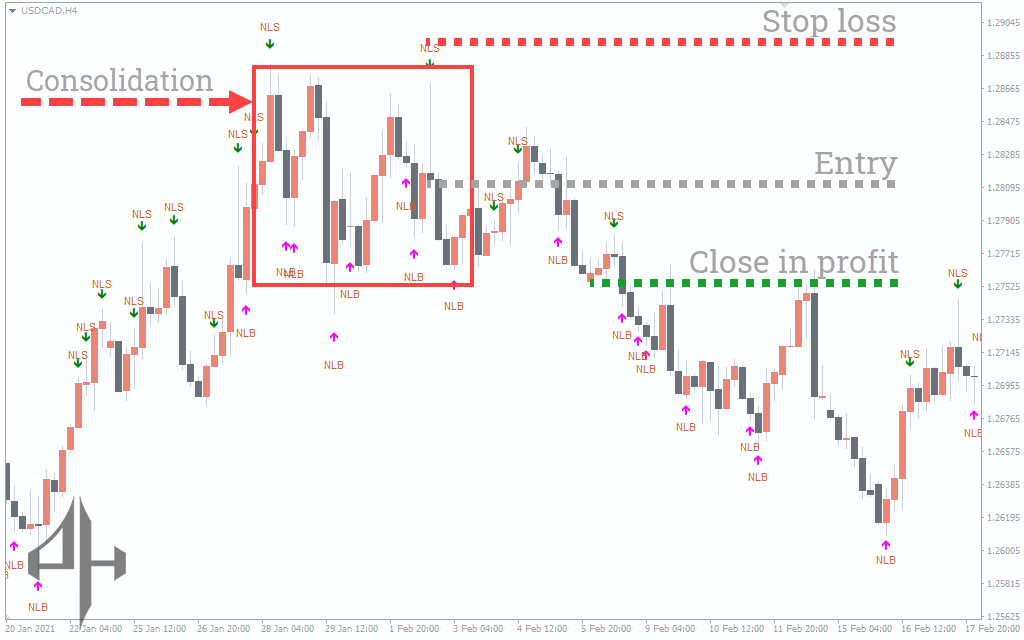
Sell Setup
-
Use a 4-hour timeframe.
-
Set hightwick1 to 50 and hightwick2 to 25.
-
Set lowtwick1 to 50 and lowtwick2 to 25.
-
Identify areas of price consolidation.
-
Look for a candle with a green arrow above it labeled NLS.
-
Enter a short position with a stop-loss placed above the candle’s shadow.
-
Close the position for a profit when a pink arrow appears below the candle labeled NLB.
Conclusion
You can identify the purchasing or selling pressure using My Price Action indicator. It lessens the work required to manually identify the patterns, just like any technical signal, but you cannot rely only on it. Before using a live account, you might need to backtest the tool or other confirmatory tools.
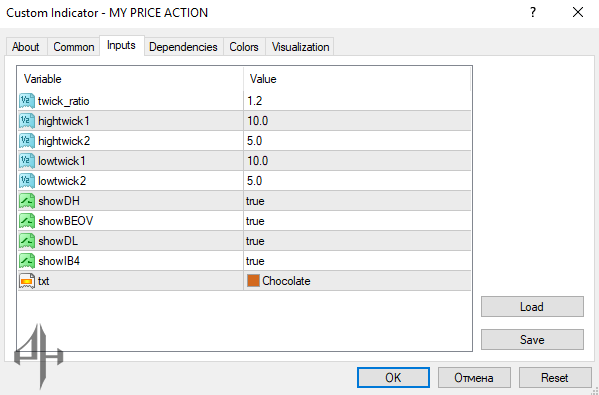
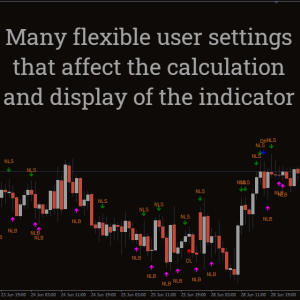
There are several customizable settings available:
-
Twick_ratio: Defines the ratio between the high and low values.
-
Hightwick1: Specifies the height of the upper wick in pips.
-
Hightwick2: Specifies the height of the second upper wick in pips.
-
Lowtwick1: Specifies the depth of the lower wick in pips.
-
Lowtwick2: Specifies the depth of the second lower wick in pips.
-
ShowDH: When set to true, displays the daily high on the candle.
-
Show BEOV: When enabled (true), shows BEOV patterns (similar to pin bars) on the chart.
-
ShowDL: Displays the daily low on the chart.
-
ShowB4: Indicates new lower lows or higher lows on the chart.
-
Txt: Allows customization of the label colors.