MACD Divergence Indicator, Detect Critical Market Shifts Before They Happen
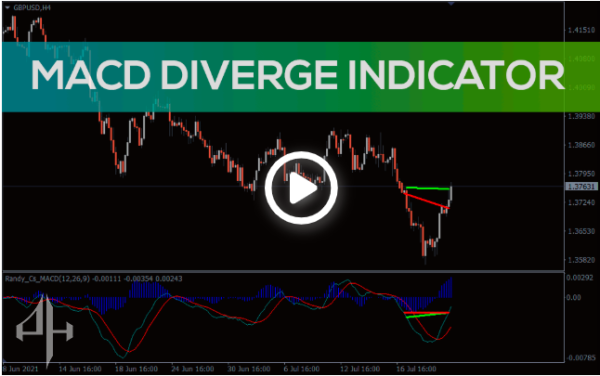
Traders may identify any divergence between the price and the MACD indicator with the aid of the MT4 MACD Divergence Indicator.
- Description
- Reviews (0)
- Indicator Settings
Description
The best indicator of impending trend continuance or reversal in the currency market is divergence. When the price and the oscillator move differently, the MACD Divergence Indicator is activated.
The MACD Divergence Indicator is the most effective oscillator for identifying divergence.
The foundation
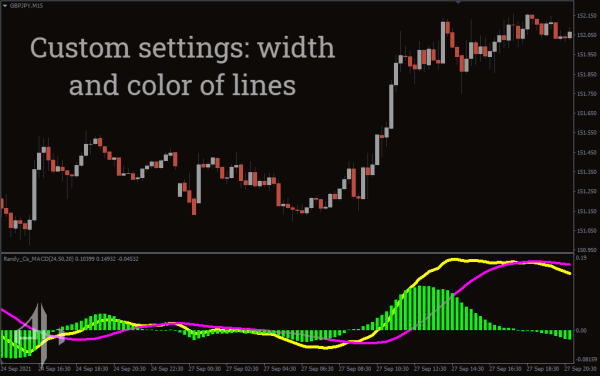
MT4’s MACD Divergence Indicator assists traders in identifying price deviations from the MACD. This indicator has 12 EMA and 25 EMA in addition to a volume histogram.
The direction and strength of the trend are displayed by the MACD volume histogram. As a result, trend reversals are identified using the MACD’s 12 and 25 EMA.
Both regular and concealed divergence can be detected with the MT4 MACD Divergence Indicator. This indicator is used by experienced traders to enter safer and more profitable transactions. The greatest way to spot a trend continuation or reversal early on is with this indicator.
How to spot a Divergence using MACD Divergence Indicator
Usually, there are two types of divergence: ordinary divergence and hidden divergence. Whereas a hidden divergence indicates that a trend is continuing, a regular divergence identifies a trend reversal.
When the price produces lower lows, a positive regular divergence raises the low MACD. On the other hand, when the price reaches a higher high, a bearish regular divergence produces a lower high MACD.
When the price hits a higher low, a bullish hidden divergence results in a lower low MACD. Lastly, when the price reaches a lower high, a bearish hidden divergence produces a higher high MACD.
How to make trades with the MACD Divergence Indicator
When there is bullish regular divergence, a downtrend is coming to a close and an uptrend is starting. The bullish regular divergence is therefore a purchase signal.
When the downturn has finished, bearish regular divergence signals the start of an upswing. A bearish regular divergence is therefore a sell signal.
Additionally, a disguised bearish divergence is a tip to go long and indicates that an upswing is continuing. The EUR/USD H4 chart that follows demonstrates how to use this indicator to enter and exit trades.
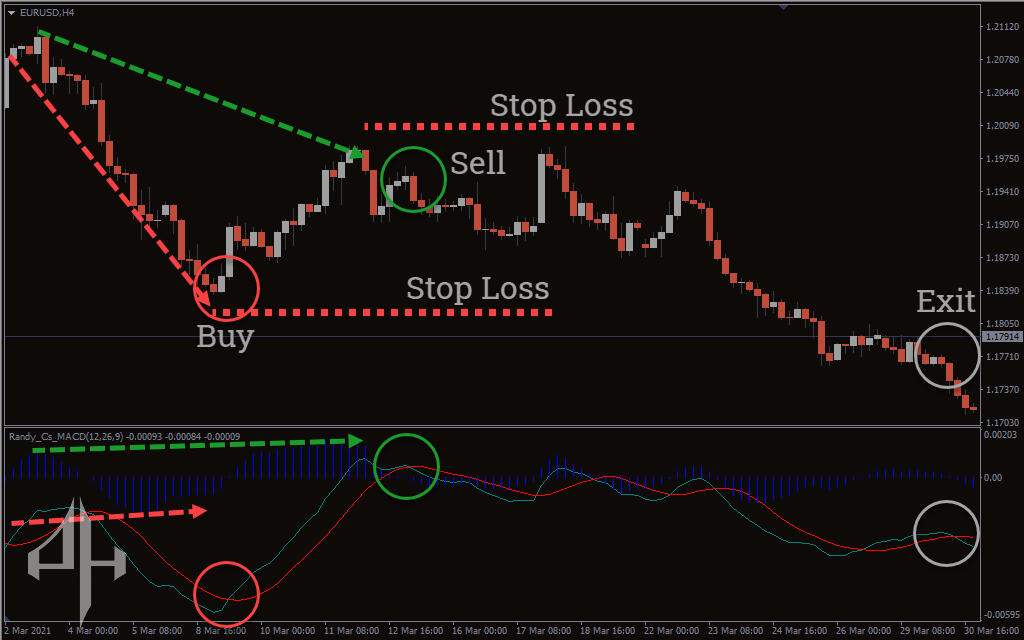
Between March 1 and March 9, 2021, a bullish hidden divergence developed between the indicator and the price. Red trendlines on the chart and indicator showed this divergence. An impending rise was so indicated by the MACD Divergence Indicator. On March 9, 2021, a bullish engulfing candle was also formed.
The fast 12 EMA crossed the sluggish 25 EMA upward, confirming a buy trade. A stop loss was set just below the most recent swing low (1.1823) in order to control the risk. When the fast 12 EMA moved below the slow 25 EMA, the buy trade was closed. Additionally, between March 4 and March 12, 2021, a regular bearish divergence formed on the chart. Green trendlines on the chart and indicator showed this divergence. As a result, the indicator warned of an impending decline.
Additionally, on March 12, 2021, a doji was created, indicating that bulls had reached their limit. The rapid 12 EMA crossed the slow 25 EMA downward, confirming a sell position. The SL was set slightly above the most recent swing high (1.2001) in order to control the sell trade risk. Around 1.1823, a partial profit can be made. The trade was closed around 1.1707 (when the fast 12 EMA crossed the slow 25 EMA downward).
Conclusion
Forex traders can identify price and MACD divergences with the aid of the MACD Divergence Indicator for MT4. You can use this indicator alone or in conjunction with other price movements. Traders should utilise this indicator on the H1, H4, and daily time frames for optimal results.
Be the first to review “MACD Divergence Indicator, Detect Critical Market Shifts Before They Happen” Cancel reply
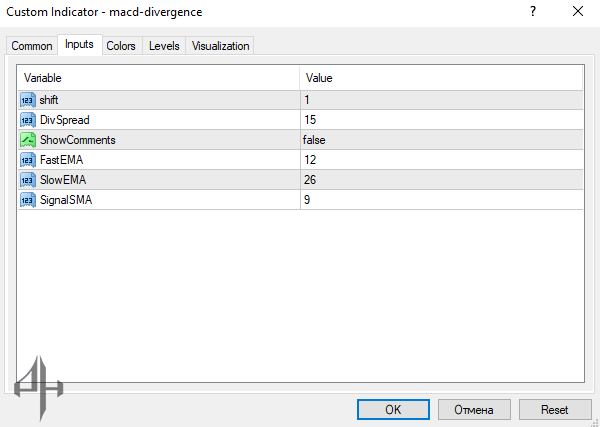
The indicator includes the following parameters in the MT4 settings:
-
Shift: Adjusts the indicator’s horizontal displacement.
-
Div Spread: Represents the spread variations.
-
Show Comments: Toggles the display of comments on or off.
-
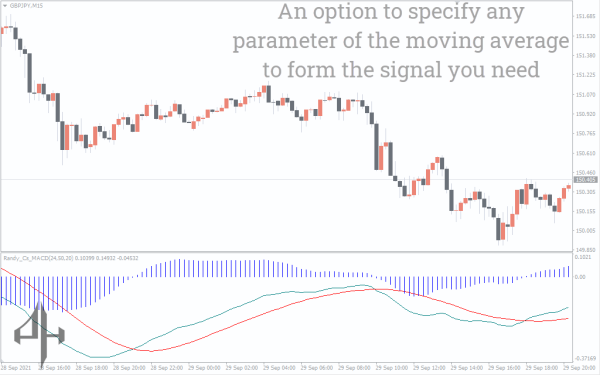
Fast EMA: Sets the period for the fast Exponential Moving Average.
-
Slow EMA: Sets the period for the slow Exponential Moving Average.
-
Signal SMA: Defines the period for the Signal Simple Moving Average.


Reviews
There are no reviews yet.