

- Description
- Reviews (0)
- Indicator Settings
Description
The Fractal Support and Resistance Indicator is an automatic horizontal support resistance indicator that is built on MetaTrader 4. Strong support and resistance zones are highlighted by the fractal line, which helps forex intraday traders identify swing and breakout trading chances.
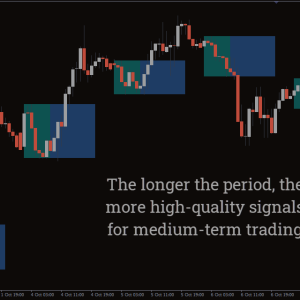
An alternative to pivot indicators is this one. The high, low, and close of the day are used to plot pivot lines. Conversely, fractal points are established based on the price’s greater highs and lower lows.
Fractal indicators typically plot a number of arrows to indicate potential trend reversals. Both horizontal and dynamic pricing channels can be found by manually joining the fractal arrows with straight lines. Fractal support and resistance is unique in that it plots horizontal price channels by automatically connecting the fractal points.
How to trade using the Fractal Support and Resistance Indicator MT4
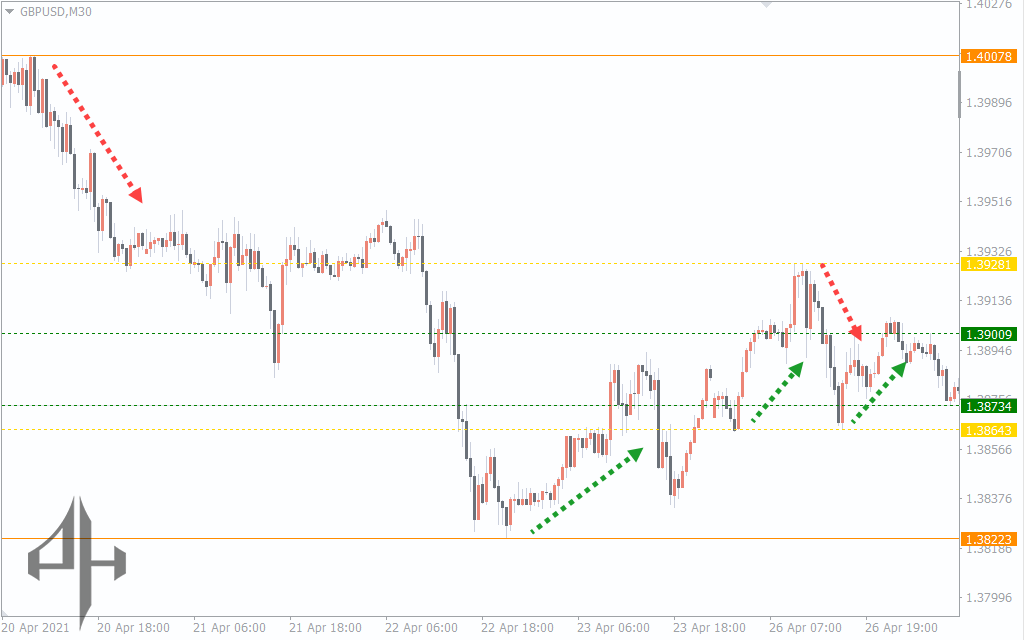
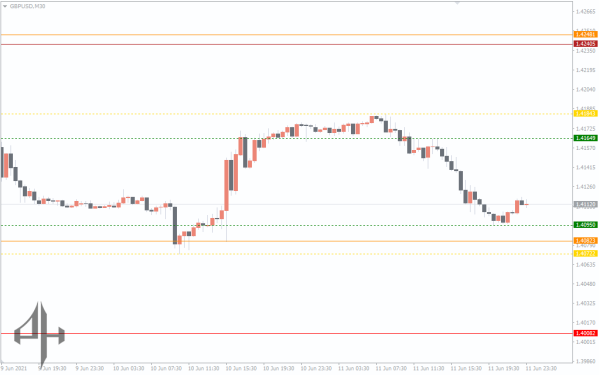
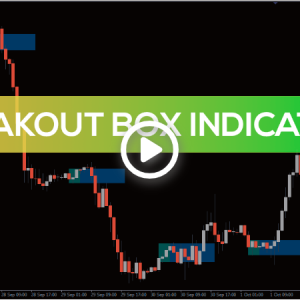
The 30-minute GBPUSD chart above demonstrates how well auto fractal channels portray levels of strong support and resistance.
The weekly S/R values are shown by the dotted fractal lines. Conversely, the market’s main intraday event zones are highlighted by the bold coloured lines. The price mostly aims to move within the fractal channels, as shown in the preceding chart. The price frequently recovers after striking the S/R zone since the channel’s horizontal levels represent significant event zones.
Therefore, look at the locations of the Fractal Support and Resistance Indicator lines first when you open an intraday chart. Second, look at how the price positions relate to the levels of the fractal. For instance, it’s time to search for a sell opportunity when the price moves directly below the fractal resistance.
Every time the price plotted a pin bar at the fractal lines, as seen in the example above, it bounced back and began to travel in the other direction. Therefore, when a bullish pin bar is drawn near the fractal support during a range movement, we can look for a buy order. A bearish pin bar at the fractal resistance, on the other hand, is a perfect indication to short.
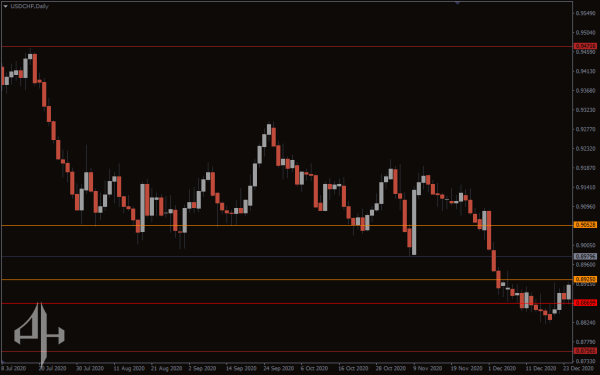
There is a good chance of a price breakout whenever the price breaks a fractal level. For instance, a bullish price breakout occurs when the price crosses over the Fractal Support and Resistance Indicator line. Wait until the price breaks below the fractal support line, on the other hand, for a bearish breakout. It is advised that you place an MT4 alert close to the fractal levels. Every time the price reaches the market’s main support and resistance zones, it will assist you draw attention.
One non-repaint MTF indication is the fractal support and resistance. This indicates that following the close of each price bar, the fractal S/R levels remain in the same positions. Additionally, when used in multi-timeframe charts, the fractal lines stay the same.
Conclusion
For forex swing traders, the fractal arrow is already a well-liked trading indicator. Furthermore, Fractal Support and Resistance Indicator give intraday price-action traders an additional edge. It is a non-repaint indicator that works well with multi-timeframe charts and provides both novice and expert traders with a significant edge.
Be the first to review “Fractal Support and Resistance Indicator, Unlock Precise Market Levels”
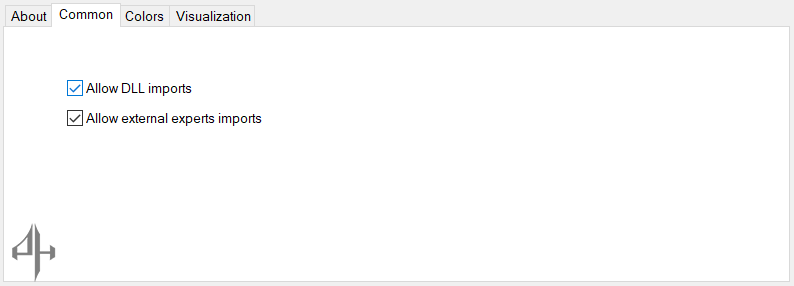
The Fractal Support and Resistance indicator offers limited customization within its MT4 settings. However, be sure to enable both the “Allow DLL Imports” and “Allow External Experts Import” options. Activating these ensures the indicator accesses updated data and displays accurate fractal levels.

Reviews
There are no reviews yet.