
- Description
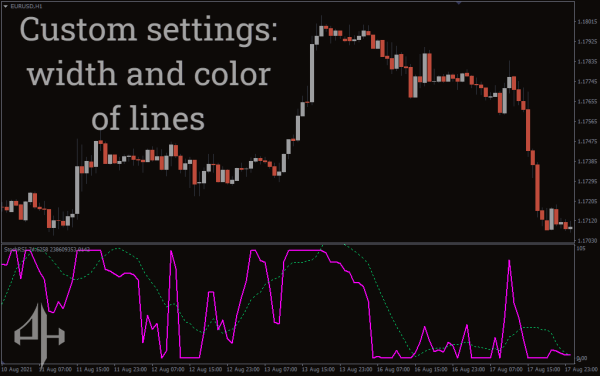
- Indicator Settings
Description
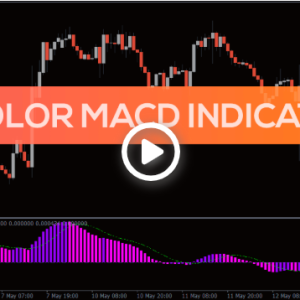
Combining the Stochastic Oscillator and Relative Strength Index (RSI), the StochRSI Indicator adds a new level of complexity to technical analysis.
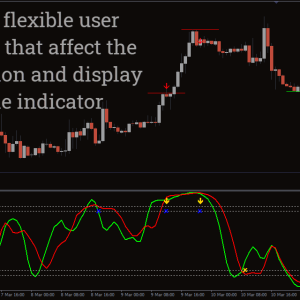
This indicator can identify trend orientations and overbought/oversold conditions by applying the RSI value over the stochastic algorithm. Furthermore, compared to the separate stochastic and RSI indicators, the StochRSI Indicator is more reactive. Because of this, it continues to be more volatile in live markets, providing real-time alerts under specific market circumstances.
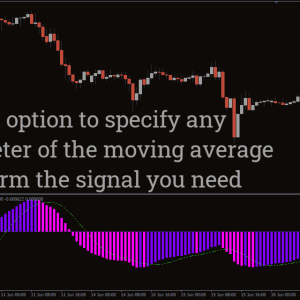
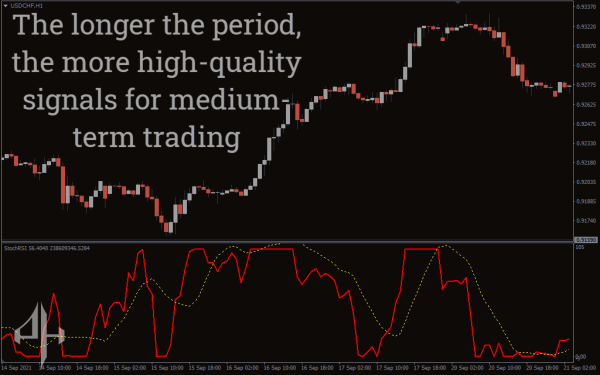
To make the indicator more appropriate for short-term trading, its sensitivity has been increased. Although they both function on all timeframes, stochastics and RSI are slower in predicting scalping and day trading signals. After combining them into a single technical tool, however, the results are entirely different.
This MT4 indicator is primarily based on stochastics. Additionally, the formula is essentially unchanged. The RSI value can now be entered into the Stochastics formula thanks to the developer’s creation. Similar to the original Stochastic Oscillator, the %K and %D lines are located at the indicator window. These lines indicate the state of the OB/OS market by moving between 0 and 100 levels.
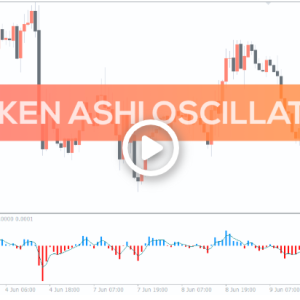
How to use MT4’s StochRSI Indicator to identify lucrative forex trading signals
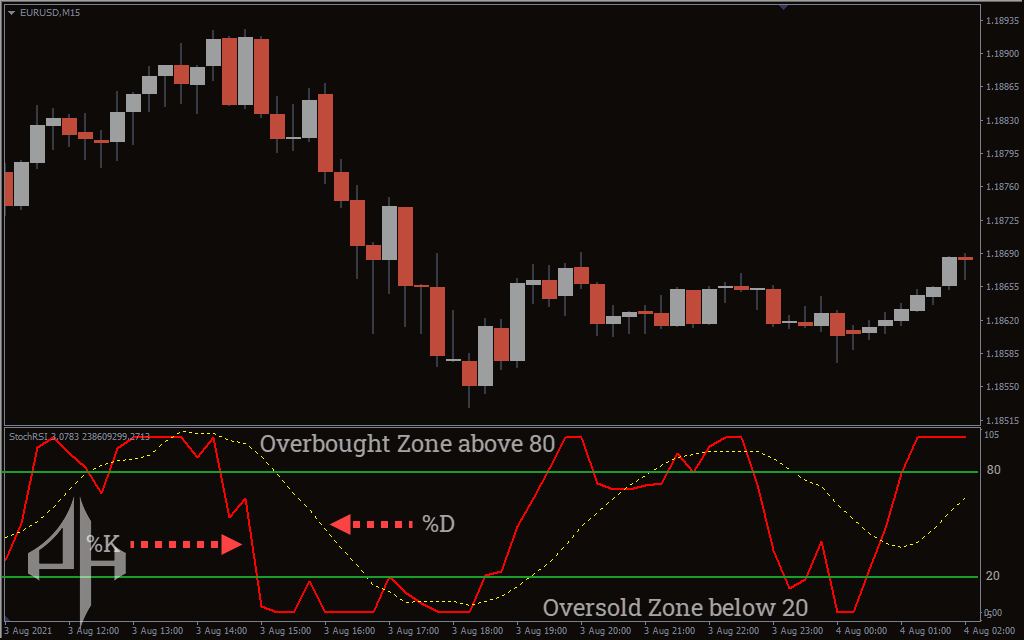
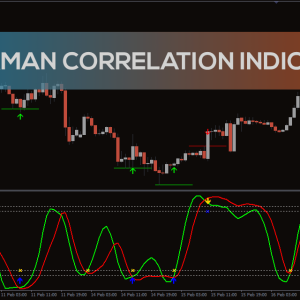
The StochRSI Indicator is renowned for its straightforward buy-sell signal demonstration. A market that is overbought is shown by the %K line above 80. On the other hand, an oversold situation is confirmed when the figure falls below 20. The moving average of the %K is the %D. It will be used to confirm the overbought/oversold signals that %K has identified.
When the Stoch RSI indicates that the market is oversold, look for opportunities to buy. The %K rising above the %D in an oversold scenario is a precursor to a bullish price reversal. In this scenario, once the indicator value surpasses 20, we can validate a purchase order. A purchase exit is indicated when the indicator line hits the overbought zone and then moves back down.
On the other hand, the market is in an overbought state when the StochRSI Indicator number rises above 80. However, the overbought market’s %K going below %D indicates that the present bullish trend is coming to an end. Following a bearish crossover with %D, the signal line returns below 80, indicating a sell confirmation. When the %K recovers from the oversold area, think about making a sell-exit.
Conclusion
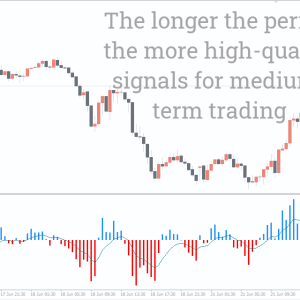
For intraday traders and forex scalpers, the StochRSI Indicator provides an excellent answer. Its traditional trend and OB/OS signal presentation is easy to read and comprehend. During adverse market conditions, this indicator may provide mixed or mediocre winning indications due to its extreme sensitivity to price-action movements. Our study indicates that StochRSI performs best in extremely volatile market conditions.
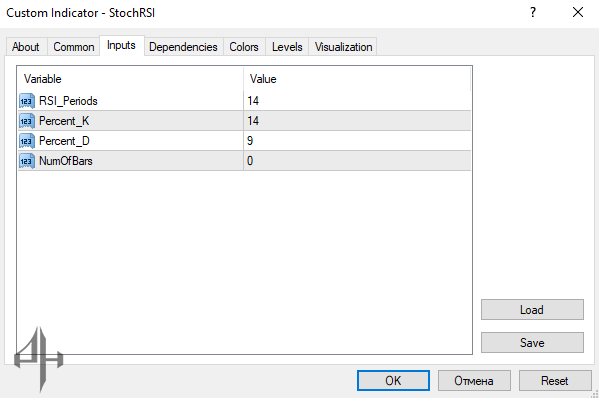
RSI Period: The number of candles used by the RSI to gather price data and convert it into index values.
Percent_K: The period used to calculate the %K, representing the difference between the highest high and lowest low.
Percent_D: The period for the moving average of Percent_K.
NumOfBars: Specifies how many bars the StochRSI results are displayed on. A value of 0 means the indicator shows results indefinitely.