

- Description
- Reviews (0)
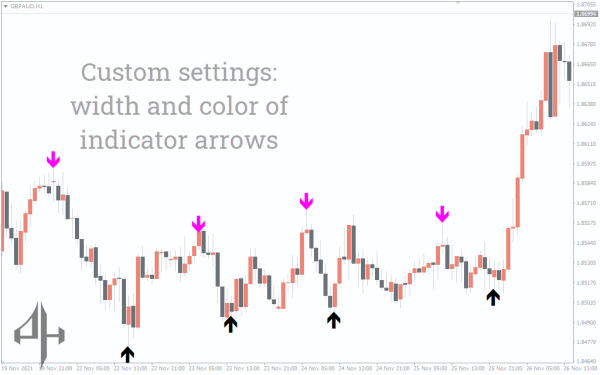
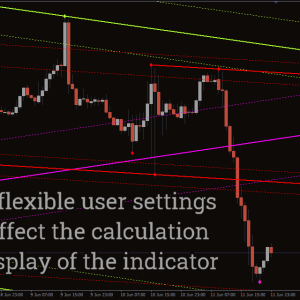
- Indicator Settings
Description
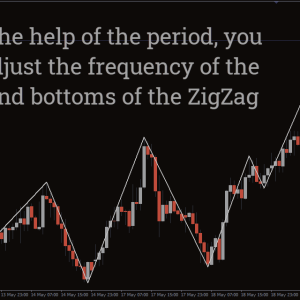
You need to be able to recognize important swing levels if your forex trading strategy relies on ideas of price action and market flow. When determining the price direction and reversal point, swing lows and swing highs are crucial points that the ZigZag Arrow Indicator can aid with.
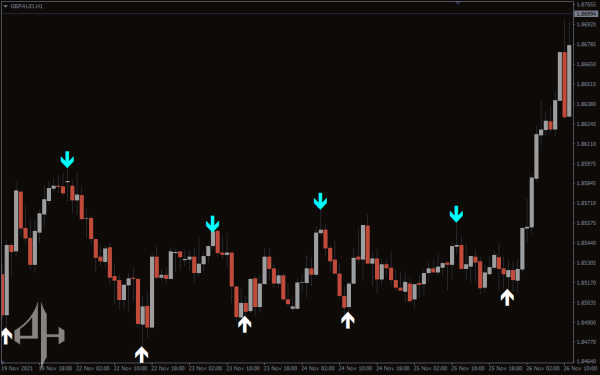
The traditional zigzag indicator and the ZigZag Arrow Indicator are somewhat similar. It aids traders in recognizing swing highs and lows with objectivity. However, the ZigZag Arrow Indicator posts arrows as the name implies, in contrast to the standard zigzag indicator, which joins the swing highs and swing lows to create a zigzag-like, downward structure. Swing highs are shown by the red arrow down, and swing lows are indicated by the blue arrow up.
Because of this, it is quite easy to use, even for novice traders. Additionally, you can trade any currency pair using the indicator on any time frame.
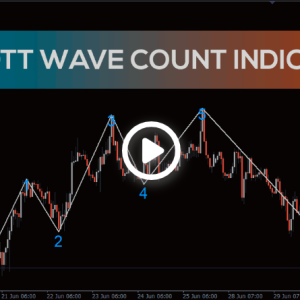
The ZigZag Arrow Indicator: A Tool for Recognizing Up and Down Trends
Let’s go on to the exciting phase. How can you trade profitably with the indicator? A market with rising highs and swing lows is considered to be in an uptrend according to price action method. Swing lows are higher than swing lows before them, and swing highs are higher than swing highs before them.
Conversely, when swing highs are lower than prior swing highs and swing lows are lower than previous swing lows, a downtrend is formed.
Once these points have been identified, you can use additional tools and tactics to find the best time to enter the market. At the swing high, for example, you may wait for the price to develop a bearish price or chart pattern. To create confluence and enter the market at the right time, it is also wise to wait for a bullish signal at the swing low.
Buy Signal: Enter at the candlesticks’ close after waiting for the indicator to post a blue arrow. Above the candlestick, position the stop loss.
Sell Signal: Enter at the candlestick’s close after waiting for the indicator to display a red arrow. Put the stop loss beneath the open candlestick.
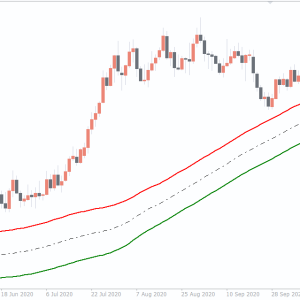
An Example Chart
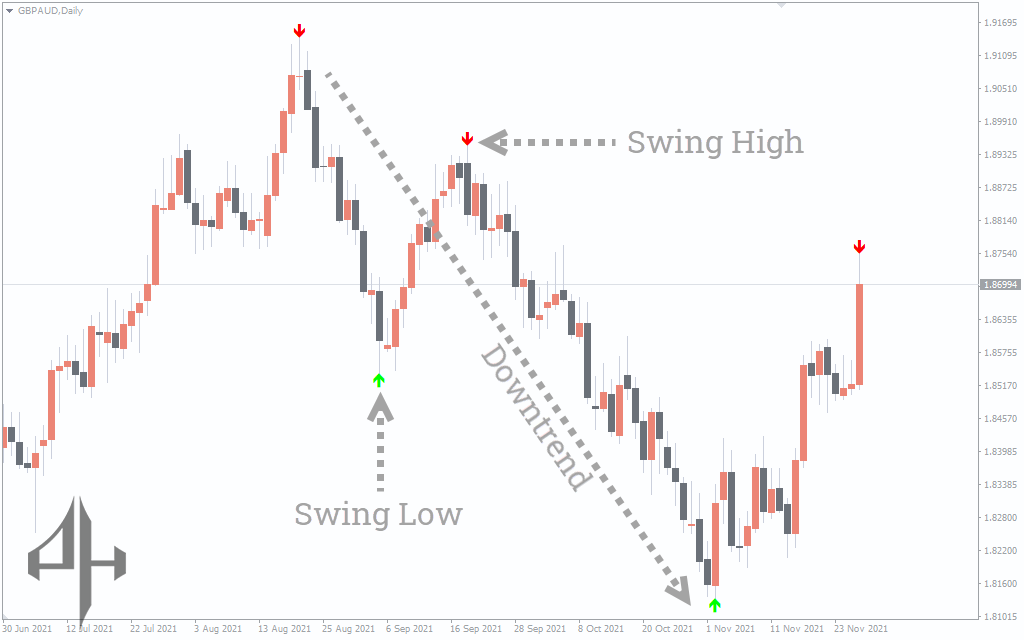
The price fluctuation of the British pound in relation to the Australian dollar is depicted in the above chart. A downtrend is shown by the red arrow’s swing high, which forms lower than the prior swing high. A lower swing low follows the swing low shown by the green arrow. This is a clear indication of a downward trend. The stop loss might be set below the swing low or a few pip above the swing high.
Conclusion
Swing highs and lows can be objectively identified with the use of the ZigZag Arrow Indicator. To decide when to enter the trade, you can then use other technical tools and tactics. Avoiding closing deals because of small pullbacks is the main goal. You will undoubtedly need this indication.
Be the first to review “ZigZag Arrow Indicator, Capture Profitable Reversals”

ExtDepth: The number of bars considered by the indicator to determine highs and lows.
ExtDeviation: The percentage price change required for the trend line to switch from positive to negative.
ExtBackstep: The minimum number of bars required between plotted swing highs and swing lows.
Reviews
There are no reviews yet.