

- Description
- Reviews (0)
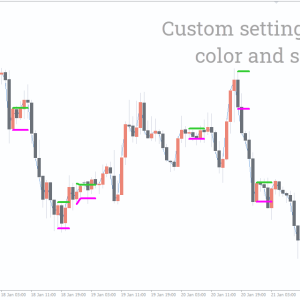
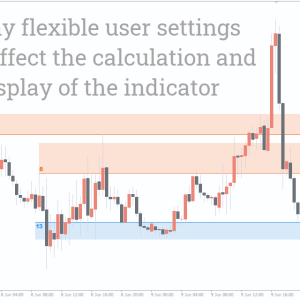
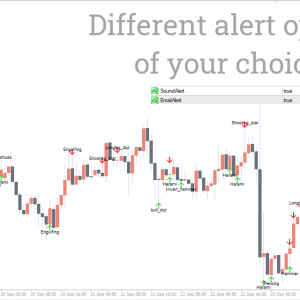
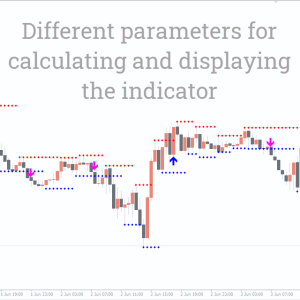
- Indicator Settings
Description
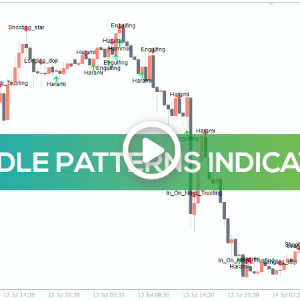
The MT4 inside bar indicator plots the traditional inside bar candlestick pattern on the current chart after automatically searching the chart for it. Thus, forex traders can use the indicator to trade the pattern. Compared to other trading methods, the inside bar trading approach is profitable because of its extremely tiny stop loss. Additionally, both bullish and bearish market situations allow forex traders to trade the inside bar pattern. However, traders should check the pattern using price action before making a purchase or sale.
The indicator performs effectively on the daily, weekly, and monthly price charts as well as in all intraday time frames. The indicator is profitable for both novice and experienced forex traders. To validate the pattern breakout and trade appropriately, novice traders must comprehend price action. However, sophisticated traders use this pattern in their intricate trading plans. The indicator can also be used for automated trading techniques by FX traders.
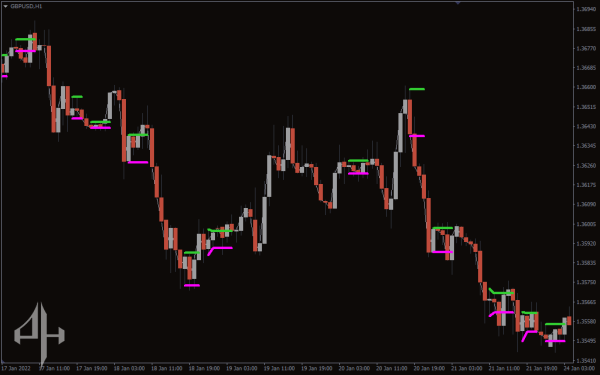
MT4 Trading Signals Inside Bar Indicator
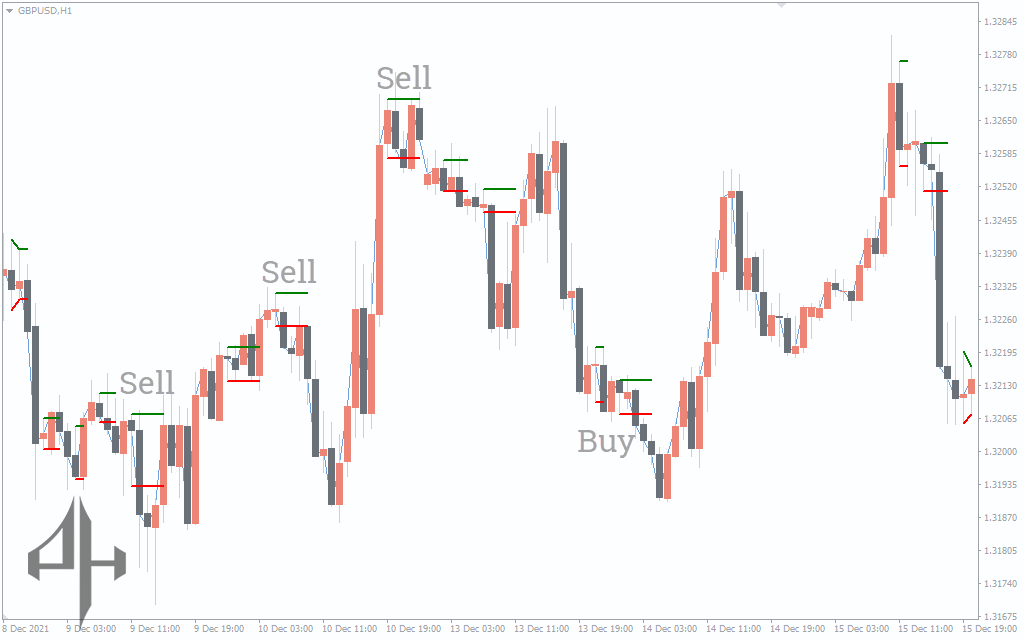
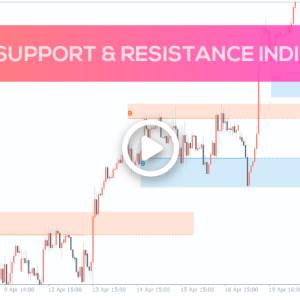
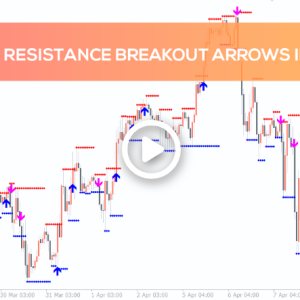
The GBPUSD H1 price chart above displays the MT4 inside bar indicator in operation. The indicator displays the inside bar pattern’s high as a green line and its low as a red line.
Two candlesticks make up the inside bar pattern. The first candle, commonly referred to as the mother candle, engulfs the second candle in this candlestick design. It is important for forex traders to be aware that this pattern could be a continuation or a reversal. However, compared to trading reversals, trading as a continuation pattern throughout a trend may yield better outcomes.
The indicator plots the pattern’s high and low on the chart if it appears during an upswing. A bullish price trend is indicated if the subsequent candle breaks to the pattern’s peak. Therefore, forex traders ought to join the market with a stop loss below the pattern’s low and a BUY position. Nevertheless, the pattern does not forecast take-profit. In order to record gains, traders need have a favorable risk to reward ratio.
Likewise, the indicator depicts the pattern’s high and low if it appears during a decline. A bearish market trend is indicated if the subsequent candle breaks the pattern’s low. As a result, traders ought to initiate a SELL trade with a stop loss above the high of the pattern. With a favorable risk-reward ratio, traders ought to abandon the position.
When determining the trend direction, the breakout’s direction is crucial. Therefore, for lucrative outcomes, traders should employ price movement to validate the breakout path.
Conclusion
The MT4 inside bar indicator is actually a scanner for candlestick patterns. But only after verifying with price movement may traders trade the pattern in both bullish and negative situations. As a result, novice forex traders need to become acquainted with price activity. Traders can also easily install the indicator after downloading it for free.
Be the first to review “Inside Bar Indicator, Dominate Price Action”
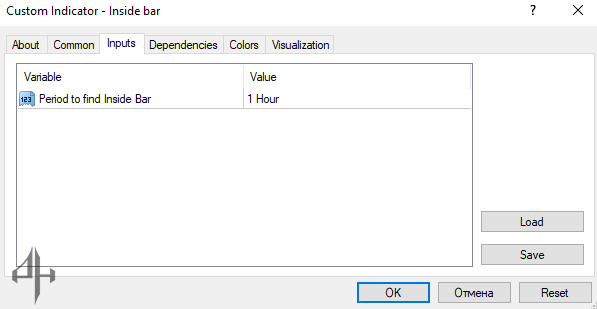
Period to Find Inside Bar: Set the preferred chart time frame for indicator calculations. The chart time frame must be equal to or smaller than the indicator’s input time frame.
Reviews
There are no reviews yet.