- Description
- Indicator Settings
Description
Sidelined or neutral market trend situations are automatically detected by the Sideways Detector indicator. It assists you in avoiding trading in volatile markets. In order to help you identify possible price breakout levels, it also draws attention to the sideways market ranges.
After breaking the peak or low of a stalled market, the price typically starts new trend moves in financial trading. With the help of these breakout moves, traders can capitalize on the current market momentum and turn it into possible trend-following trading chances. Thus, it is crucial to keep an eye on the sideways markets in addition to identifying on-trend price situations.
However, it takes a lot of work to keep an eye on the chart all day in order to identify such price conditions. Therefore, scalpers and intraday breakout traders always benefit from having an MT4 like Sideways Detector Indicator.
You will discover how to use Sideways Detector Indicator in MT4 to find sidelined markets and possible breakout trading signals after reading this guide.
How to use MT4’s Sideways Detector Indicator to identify breakthrough trading signals
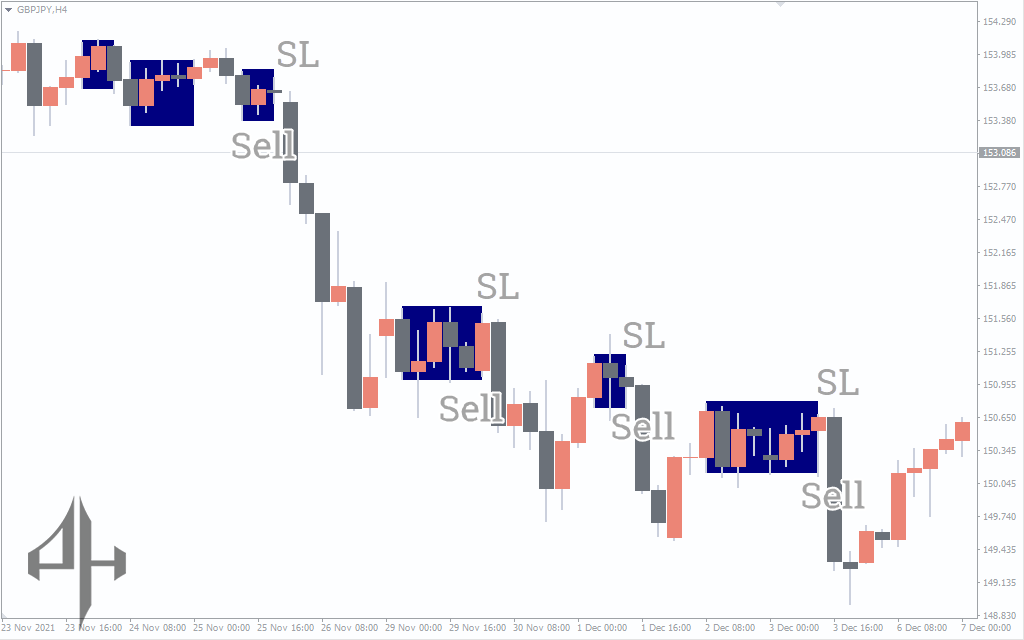
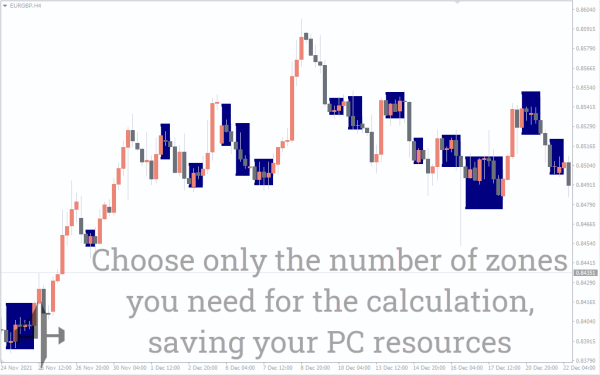
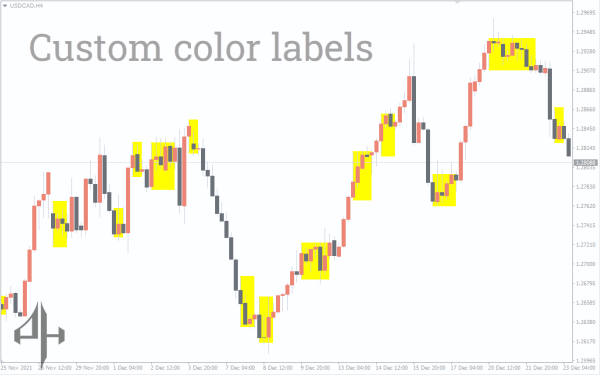
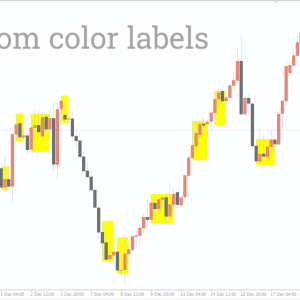
In order to identify flat market patterns, the Sideways Detector Indicator continuously tracks the price candles’ highs and lows. Every time the price starts to move inside a smaller range, it highlights the locations with a blue rectangle. It shows that the price is presently fluctuating inside the rectangle and has not yet determined which way its next trend will go.
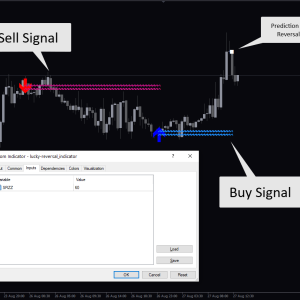
The price may break out of the sideways range in either direction, depending on the mood of the market. When the price plots a bullish breakout above the blue area, activate buy orders. And when the price breaks below the box’s low in a bearish breakout, look for sell entries.
False price breaks near the rectangle’s boundary can occasionally occur, resulting in lost trades. However, if you just look at entries that are plotted in the direction of the current trend, you can still increase your winning percentage.
For example, only place purchase orders during uptrending market situations when you hunt for bullish breakouts. For spotting market patterns, moving averages, MACD, and high-low techniques are the best instruments. In addition, pivots, trend lines, and support/resistance can be used to identify significant price breakouts.
Conclusion
For novices with limited trading expertise, the Sideways Detector is a simple MT4 indicator with great technical benefits. Predicting potential price breakout levels is the main objective of identifying a flat price trend. In this sense, Sideways Detector effectively illustrates the actual price range during times when the market is sidelined. Additionally, it works with the Metatrader platform’s many timeframes, enabling you to simultaneously search for possible price breakouts in MTF charts.
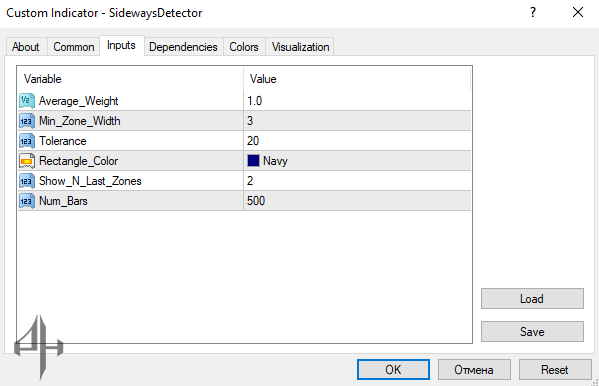
Average Weight: Specifies the weight given to recent price movements when identifying the price consolidation range.
Min Zone Width: Defines the minimum number of candles required to identify sideways or consolidating markets.
Tolerance: Adjusts the maximum allowable tolerance range for the price.
Rectangle Color: Allows customization of the color used to highlight sideways market areas.
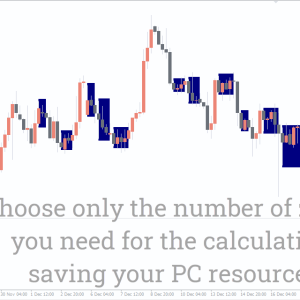
Show N-Last Zone: Determines how many rectangular boxes the indicator will plot on the chart.
Num Bars: Sets the maximum number of price bars the indicator will track to detect range-bound or sideways markets.