- Description
- Indicator Settings
Description
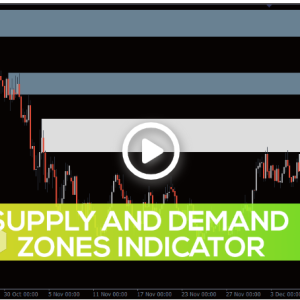
The SupDem Indicator is built to identify and trade Supply & Demand zones based on price behavior.
-
A sharp upward price movement indicates demand greatly exceeds supply.
-
A sharp downward price movement suggests supply significantly exceeds demand.
It makes little difference whether the reversal was due to technical or fundamental grounds. The ultimate forces of supply and demand are the sum of all the elements.
Therefore, the SupDem Indicator shows support zones in blue and resistance zones in yellow based on significant price chart reversals.
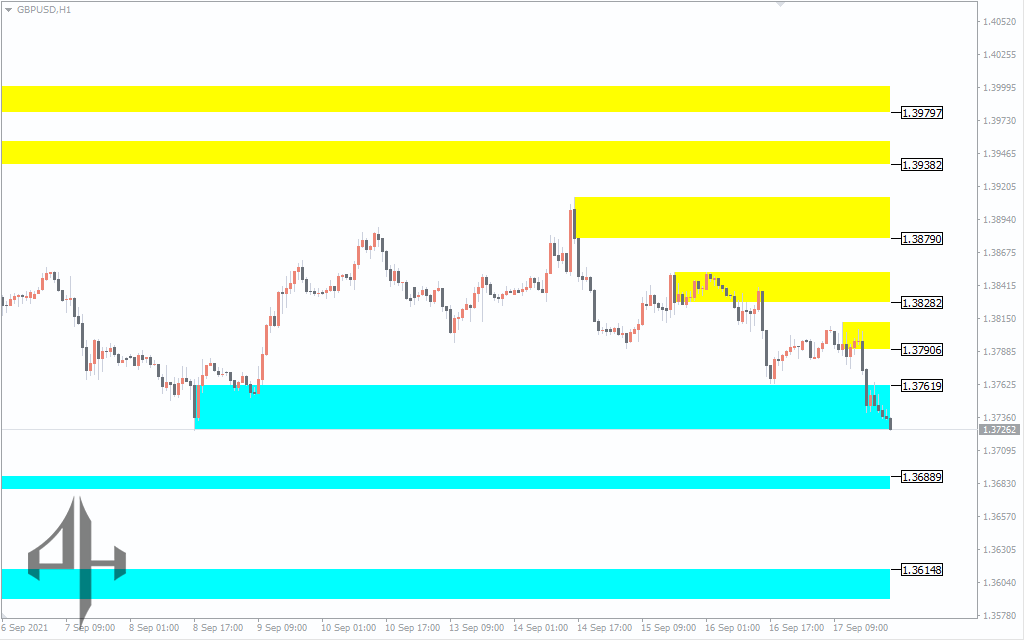
These blue and yellow zones are immediately eliminated from the chart as the price crosses through them.
How to trade with SupDem Indicator
Simple buy and sell signals using arrows, line crossovers, or other indicators are not provided by SupDem.
The indicator’s support and resistance zones are yours to employ however you see fit.
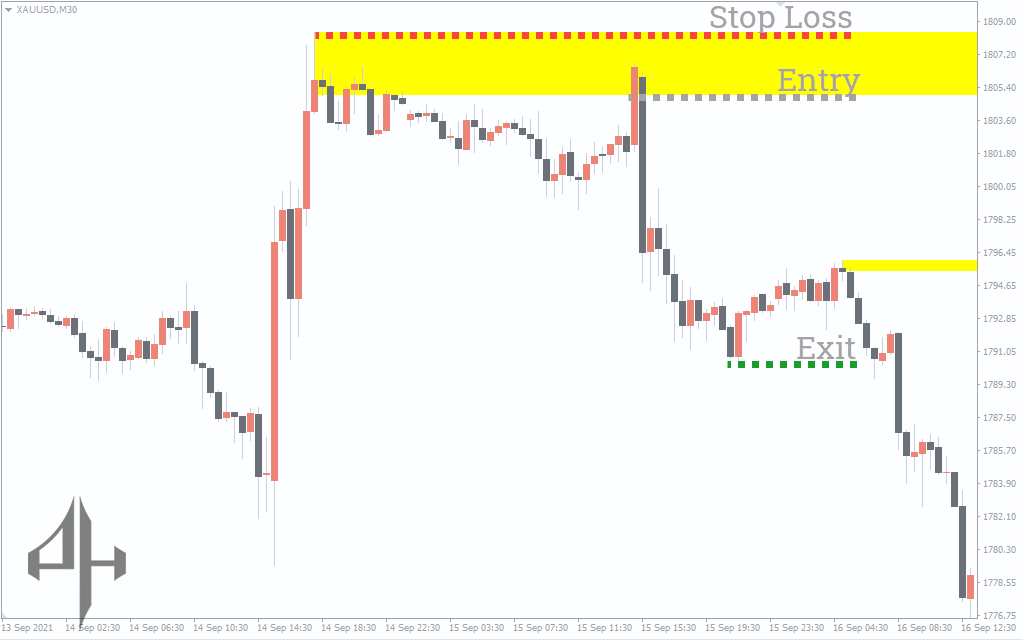
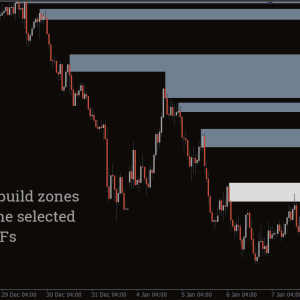
The chart above illustrates one way to use the Supply and Demand indicator for intraday trading:
-
Place a sell-limit order at the lower edge of the resistance zone.
-
Set a protective stop order just above the upper edge of the resistance zone.
-
Aim to take profits near the previous local low.
Make sure you have a favorable R:R ratio.
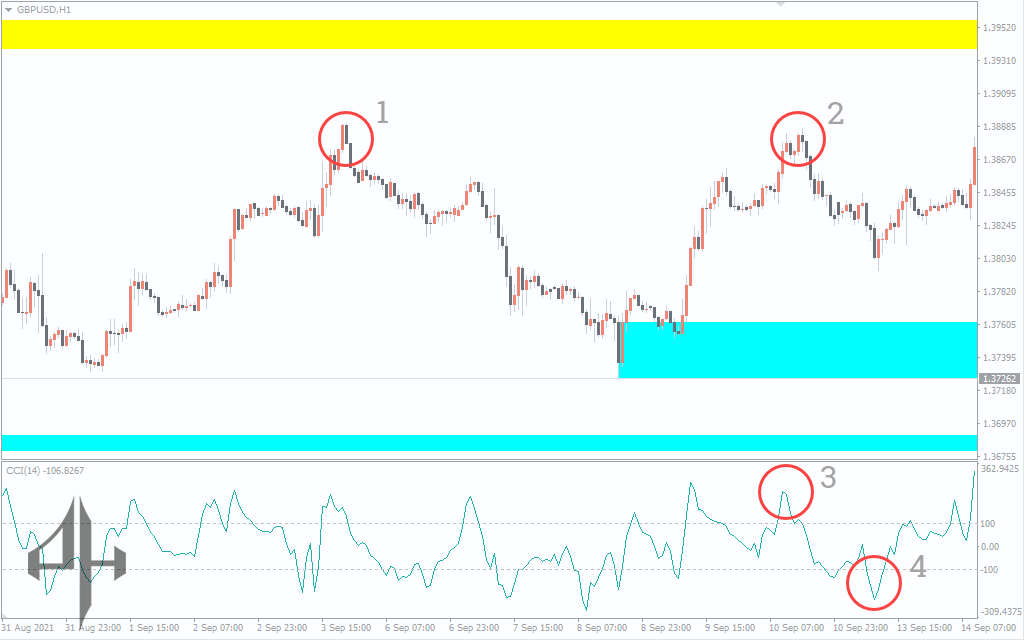
Here’s how you can use the SupDem indicator alongside another indicator:
-
A supply zone formed at point 1 (not visible on the chart as it has expired).
-
Wait for the price to revisit this zone at point 2.
-
Open a short position when the CCI indicator gives a sell signal at point 3.
-
Close the position when the CCI gives an opposite signal at point 4.
While this example uses the CCI, you can substitute it with any indicator you trust. The key is to always manage your risk carefully.
Conclusion
The Supply & Demand Indicator for MetaTrader 4 helps traders identify and trade around key levels without repainting.
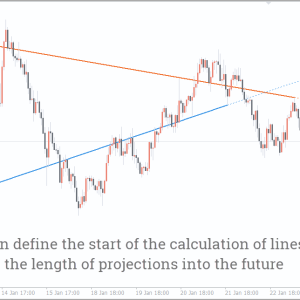
Using price pattern data, the SupDem Indicator defines:
-
Supply zones (resistance)
-
Demand zones (support)
This indicator enables you to:
-
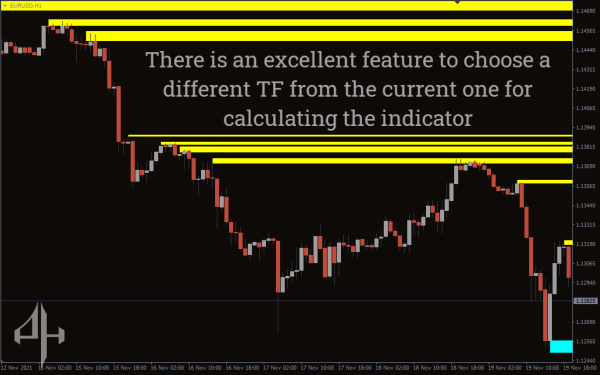
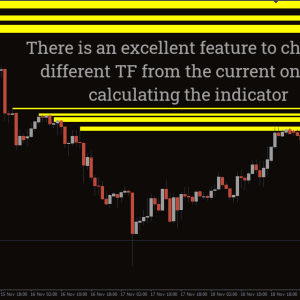
Display supply and demand zones across multiple timeframes
-
Trade near significant price levels
-
Combine supply and demand zones with signals from other indicators for more informed decisions
Be advised that Metatrader’s Supply & Demand Indicator does not always provide the best buy and sell indications. The SupDem does not provide a 100% chance that the market will reverse at the same level if it has already done so once.
Make sure that trading with this indicator won’t damage your deposit as a result. Train trading on a demo account with a preferred broker first in order to do this.
Get the MT4 Supply & Demand Indicator for Free Right Now!
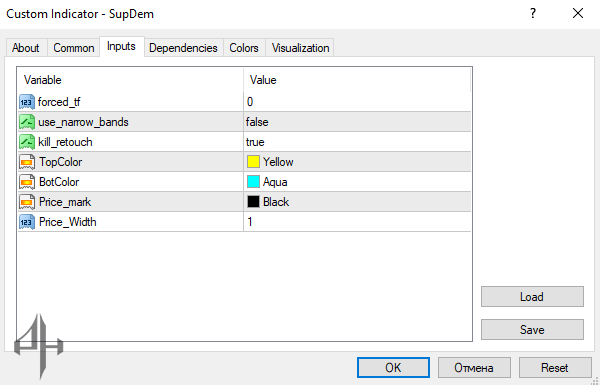
Forced TF: Enter the period (in minutes) for which you want the indicator to generate supply and demand zones. Leave at 0 to use the current timeframe.
Use Narrow Bands: Set to false if you prefer narrower bands.
Kill Retouch: Determines if the SupDem indicator will search for a new zone when the price remains within the previous zone’s range.
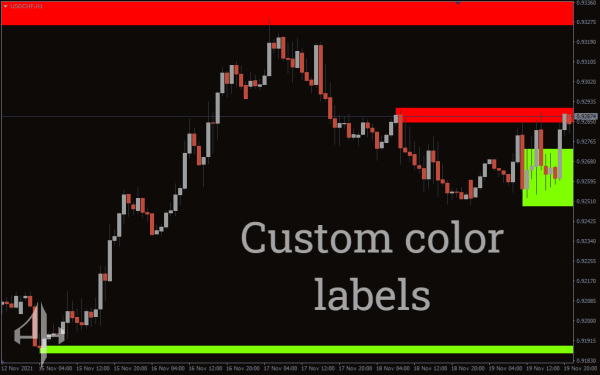
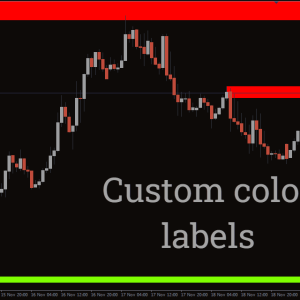
Top Color: Select the color for the supply (bid) zone.
Bot Color: Select the color for the demand zone.
Price Mark: Choose the color of the price mark on the chart.
Price Width: Sets the size of the price mark.