

- Description
- Indicator Settings
Description
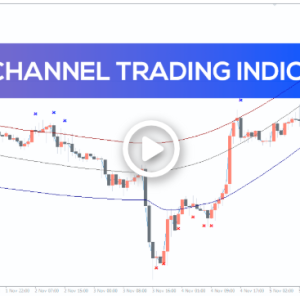
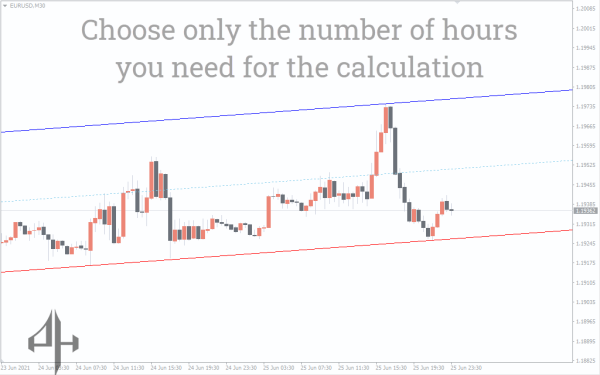
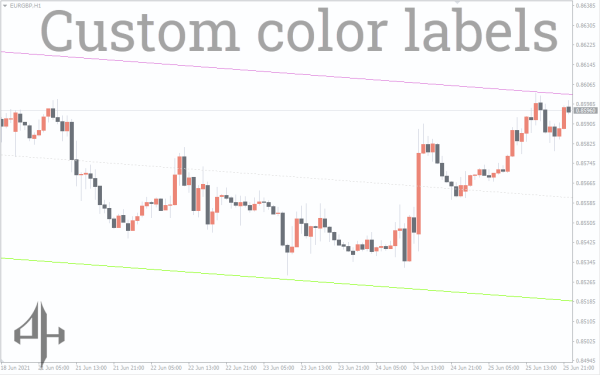
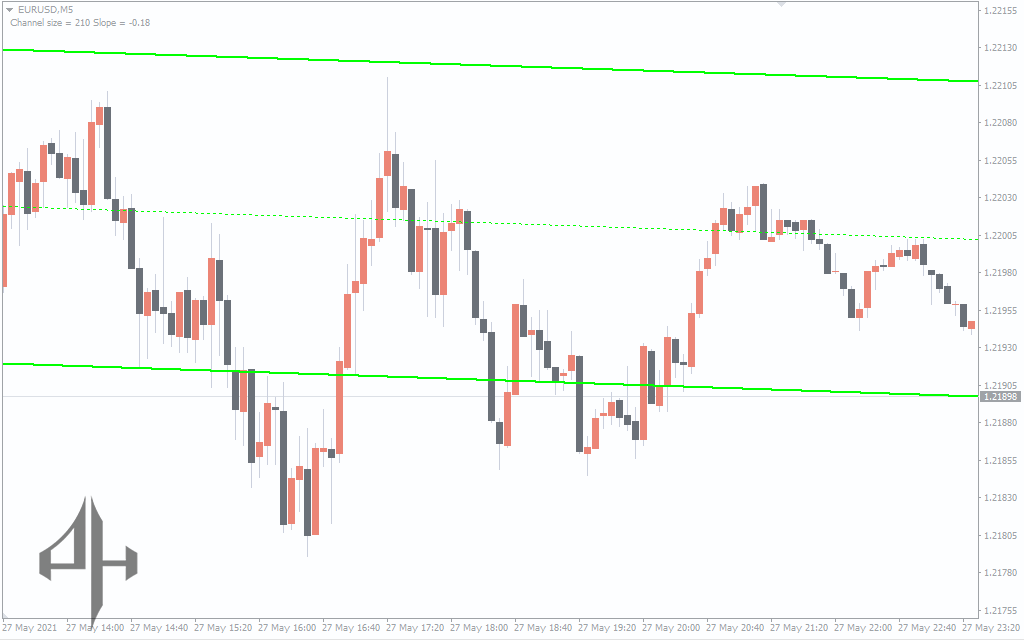
The Auto Trend Channel indicator facilitates the analysis of both short-term and long-term trend movement characteristics.
You will save a great deal of time and have better trading outcomes if you use the indicator to plot channels automatically.
In addition to serving as channel boundaries, the lines also serve as price levels. They can be used when trading pending orders thanks to these channel lines.
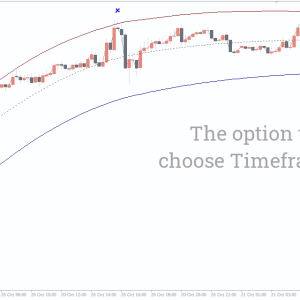
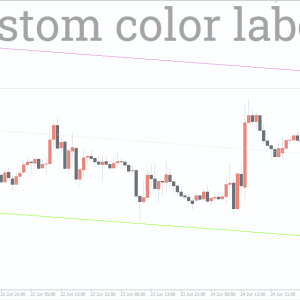
A price channel ought to show up on your terminal’s screen following the indicator’s installation. You have the option to alter the graphic settings if needed.
Furthermore, the lines’ thickness varies as well. The custom parameters determine how it changes.
What is the operation of the Auto Trend Channel indicator?
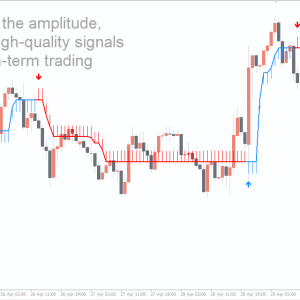
In the trend channel, prices can fluctuate in a variety of ways. Differentiate between a real and a fake collapse. A real breakthrough occurs when the price stays inside the channel for a while before breaking the resistance line. The resistance line turning into support is a sign that the breakout is real. The trader must wait for a new price channel in this situation.
One or more candles that develop after the channel is broken help us decide whether the breakout is real or not. When the price no longer returns to the trend channel, a real breakout is shown. When the price does not hit the support line in a negative trend or the resistance line in a bullish trend, it moves within the trend channel.
It should be mentioned that it is uncommon to see distinct price channel boundaries. The price movement typically indicates a breakout without confirmation. The trader must employ additional confirmation signs in this situation.
Strategy for trading with Auto Trend Channel Indicator
Using the Auto Trend Channel indicator, let’s investigate trading strategies.
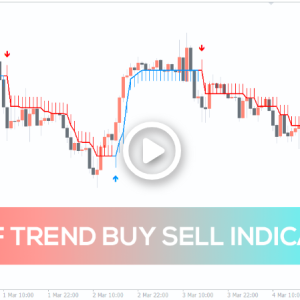
Auto Trend Channel buy setup:
-
Wait for a clear breakout above the upper boundary of the trend channel.
-
After the breakout, wait for a confirmed bullish candle.
-
Set your take profit near the nearest horizontal resistance level.
-
Place your stop-loss a few pips below the upper boundary of the trend channel.
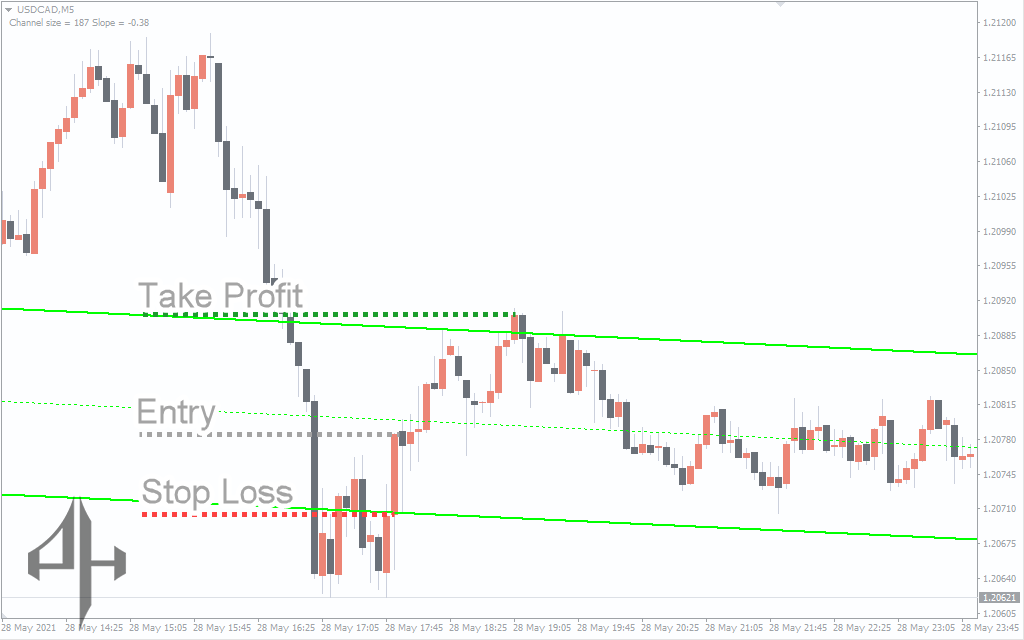
Auto Trend Channel sell setup:
-
Wait for a clear breakout below the lower boundary of the trend channel.
-
After the breakout, wait for a confirmed bearish candle.
-
Set your take profit near the nearest horizontal support level.
-
Place your stop-loss a few pips above the lower boundary of the trend channel.
Conclusion
You spend less time manually drawing a channel on the chart when you use the Auto Trend Channel indicator. You can benefit from the chart’s automatic plotting. Additionally, you can use the indicator to shape your trading strategy. However, before going live, the technique needs to be evaluated on historical data and a demo account to determine the results.
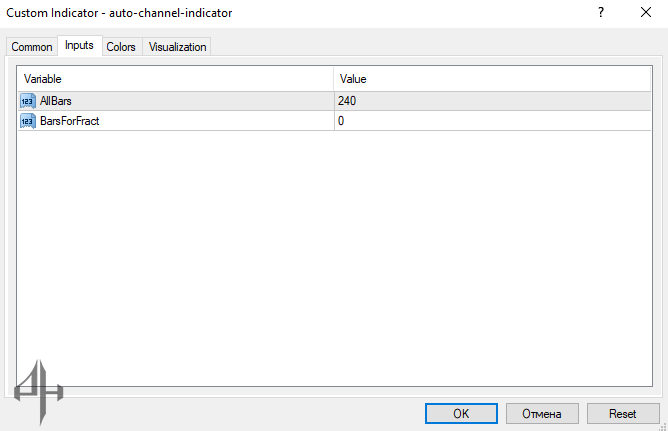
The indicator has no major settings or customization options.
-
AllBars: Default is 240, meaning the indicator analyzes the last 240 bars or candles to plot the trend channel.
-
BarsForFract: Default is 0; changing this value has no significant effect.