
- Description
- Reviews (0)
- Indicator Settings
Description
Almost all traders utilize Auto TrendLine Indicator, which are one of the primary instruments of classical technical analysis. This is due to their ease of drawing and high level of efficiency. However, because of the following, traders frequently misunderstand the lines: too many trend lines that can be formed using extremes; false or actual breakouts; and frequent redrawing of trend lines. Thus, it can be challenging for both seasoned and novice traders to create a reliable trend line. You can address this problem with the use of the Auto TrendLine indicator.
Auto TrendLine Indicator description
An indicator called Auto TrendLine Indicator shows the chart’s most reliable trend lines. Only the trend lines that the price is most likely to interact with will be plotted automatically.
Behind the indicator are a number of filters and a mathematical function that enable the display of the chart’s most important lines.
The indicator reacts to the state of the market quickly. The trend line’s slope angle changes when the price reaches new extremes; if the trend veers to the opposite or even flat, the previous, invalid trend line will be eliminated.
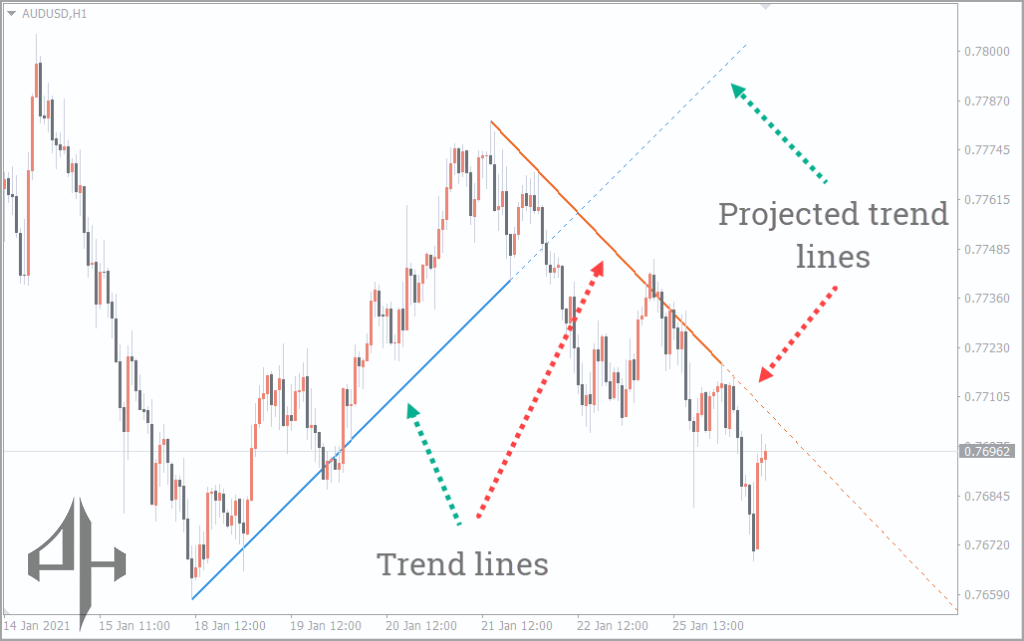
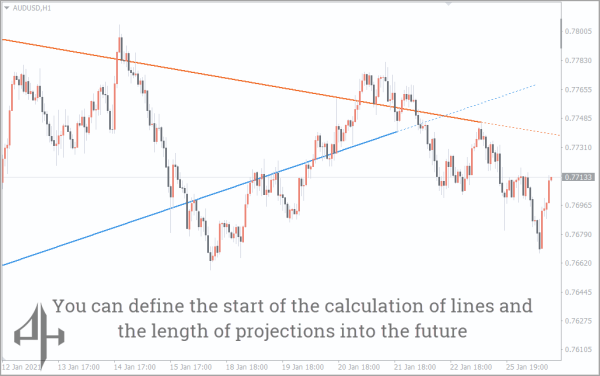
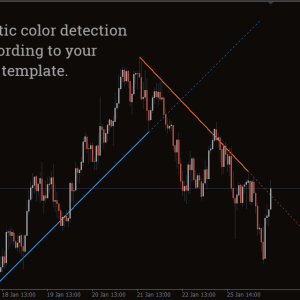
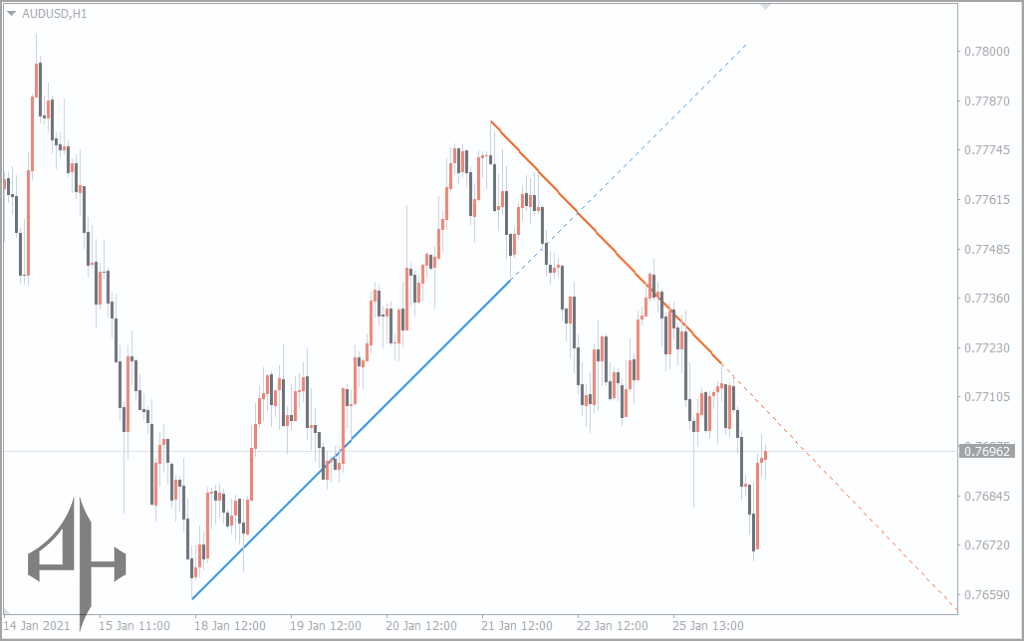
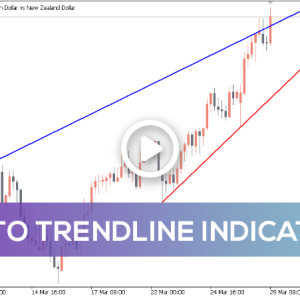
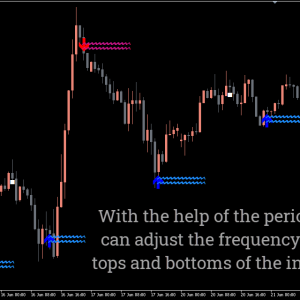
In practical use, the indicator displays two lines, each split into a solid line representing the current trend and a dotted line showing the projected trend:
-
Blue solid line – indicates an uptrend
-
Blue dotted line – represents the anticipated continuation of the uptrend
-
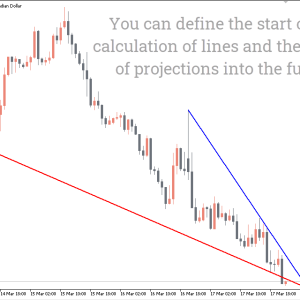
Red solid line – indicates a downtrend
-
Red dotted line – represents the anticipated continuation of the downtrend
At first glance, working with two trend lines simultaneously may seem overwhelming for traders. However, in actual trading, this dual-line system enhances your ability to interpret the chart more accurately.
For instance, by comparing the lengths of the current uptrend and downtrend lines, it quickly becomes clear that the uptrend is stronger and more sustained. The red solid line simply suggests a minor pullback in price movement.
Why Are Trend Lines Important?
In the Forex market, asset prices are influenced by numerous factors—many of which can be difficult to interpret, such as price reactions during major news events.
During such events, price volatility often increases, sometimes leading to trend line breakouts. These scenarios are common and can be challenging to analyze.
This indicator is designed to account for most price fluctuations and only adjusts the trend lines in response to genuine breakouts or confirmed trend reversals—making chart analysis more straightforward for traders.
Ultimately, the Auto TrendLine Indicator delivers a balance of simplicity and performance. It’s a helpful tool for both novice and experienced traders to better understand market dynamics.
How to Trade Using the Auto TrendLine Indicator?
Trading in the direction of the trend is widely considered one of the safest and most effective strategies, as most traders align their positions accordingly. By utilizing this trend line indicator, you’ll gain a more thorough understanding of price movements and be able to identify precise entry points for your trades.
Additionally, it is thought that the more signs that tell you to open a trade, the more trustworthy the signal is.
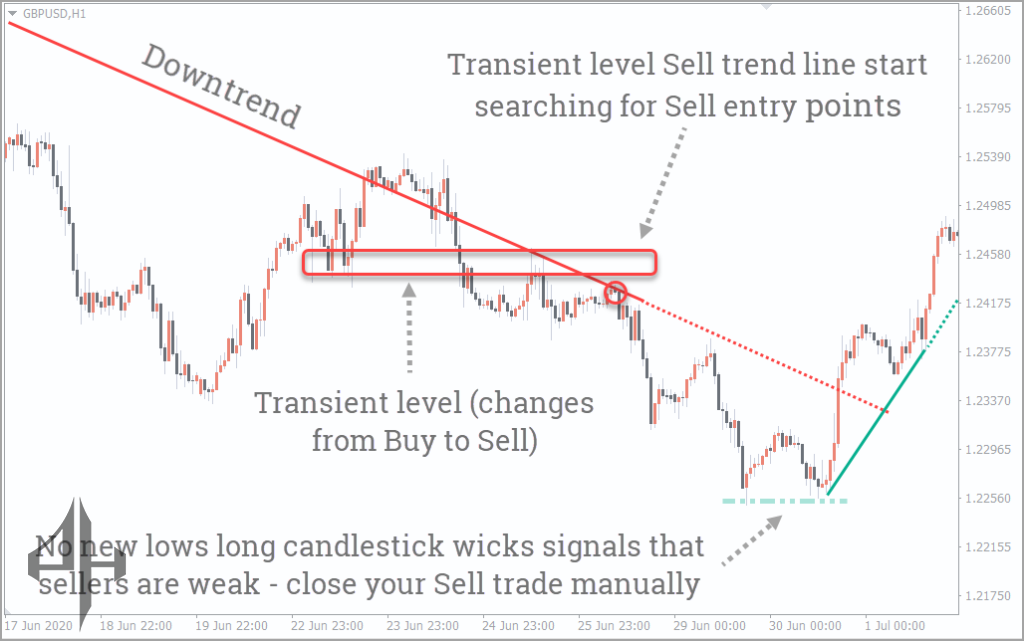
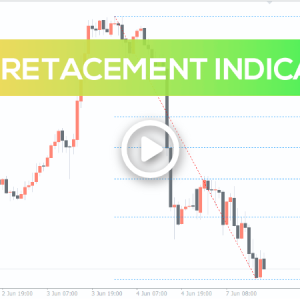
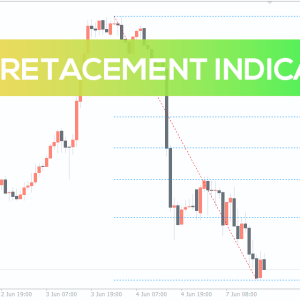
The price growth close to the downtrend line has halted, as seen in the example above, and the transitory level—which traders had previously utilized to buy but are now selling from—has fully verified the desire to sell. A pending order (take profit) or the trend change should close the transaction, and the stop loss should be placed beyond the trend line.
Thus, with a risk-to-profit ratio of 1:3, this indicator assisted in identifying a trustworthy entry opportunity.
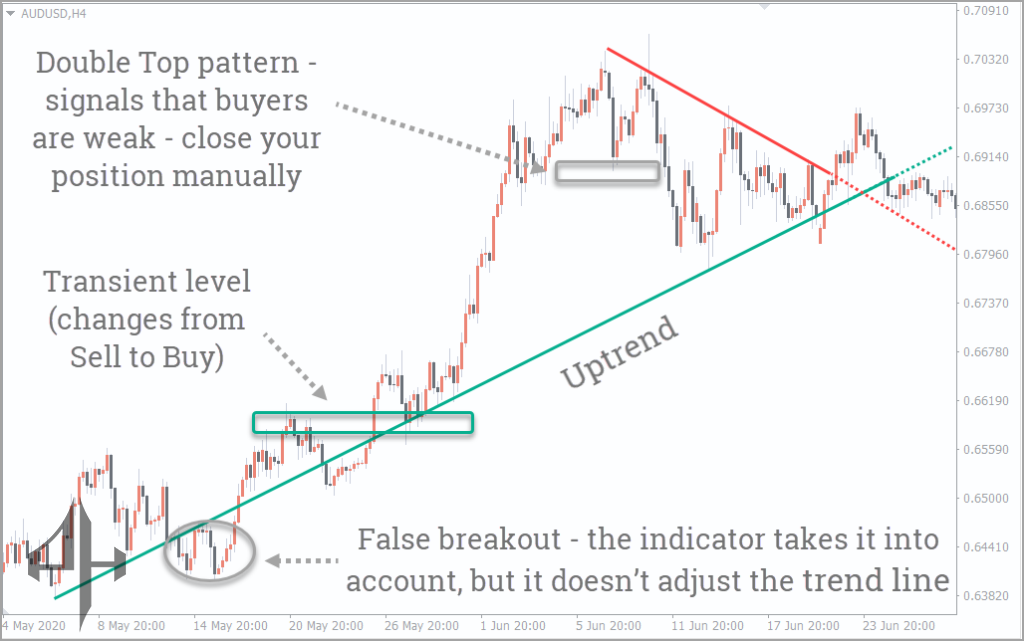
The Auto TrendLine Indicator has also been crucial to the chart’s analysis in this reverse scenario, where there is an upward trend.
First, as stated in the theory above, we would like to observe that in practice, the indicator has not redrawn the downtrend line when it appeared to be a false breakout. In the absence of the Auto TrendLine Indicator, traders would have probably modified their chart analysis, significantly distorting their perception of the market and, as a result, their trading choices.
Second, employing the trend line and the transitory level offers a solid Buy entry opportunity, just like in the selling example. The trade should be closed by a pending order (take profit) or a signal that the trend is changing (in this case, the Double Top pattern serves as the signal). The stop loss should be placed beyond the trend line.
If you decide to buy in this scenario, the risk-to-profit ratio will be 1: 3, just like in the selling case.
In this essay, we have examined the Auto TrendLine Indicator trend lines indicator. Undoubtedly, this product is merely a supplement to your trading method and is recommendatory in nature, just like all others. Because you must keep in mind that no indicator may be relied upon in its whole.
However, you may identify really significant trend lines much more easily if you use the Auto TrendLine Indicator. Additionally, the indicator may be easily used by all traders thanks to a mix of filters and parameters.
Be the first to review “Auto TrendLine Indicator, Master Market Trends with Precision”
There are just enough variables on the indicator to show the appropriate trend lines.
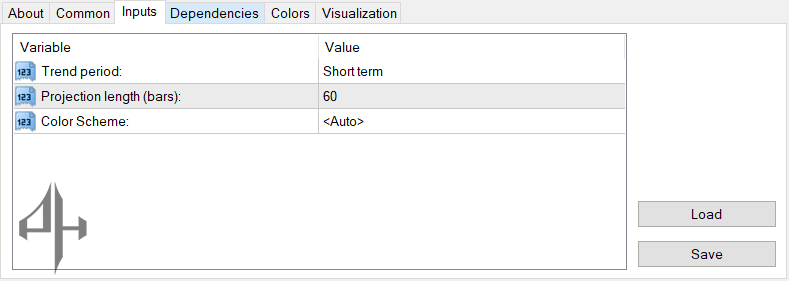
Trend Period – Defines the timeframe (short-, medium-, or long-term) over which the trend lines are plotted.
Projection Length (Bars) – Specifies the number of bars used to extend or forecast the trend line.
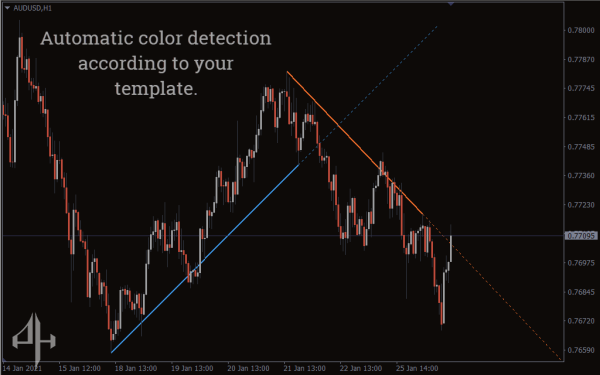
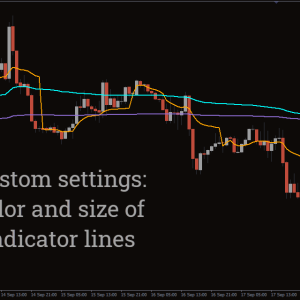
Color Scheme – Allows you to choose the visual color theme for the indicator display.
Reviews
There are no reviews yet.