

- Description
- Indicator Settings
Description
There usually comes a time in the journey of a forex trader when they are not only concerned with market trends, but also the volume behind those trends. Because knowing how much volume there is behind every trend helps to filter out minor trends from major trends. This knowledge has driven many professional forex traders to turn to the Average True Range Value Indicator (ATR). This volatility determining indicator has then become an indispensable tool for such tasks on the MT4 and other trading platforms.
The indicator we will look at is a simplified analogue of the ATR indicator, which is already installed by default in the MT4 Terminal. But it has a number of advantages, which we will tell in the article.
The Average True Range Value Indicator On MT4
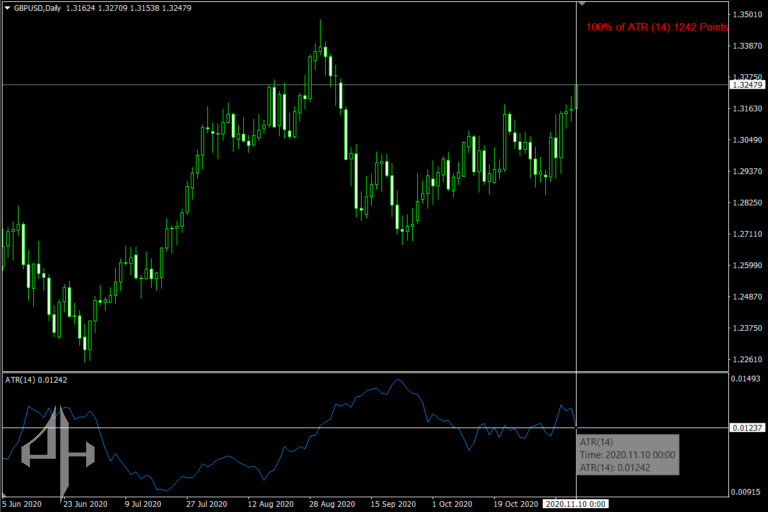
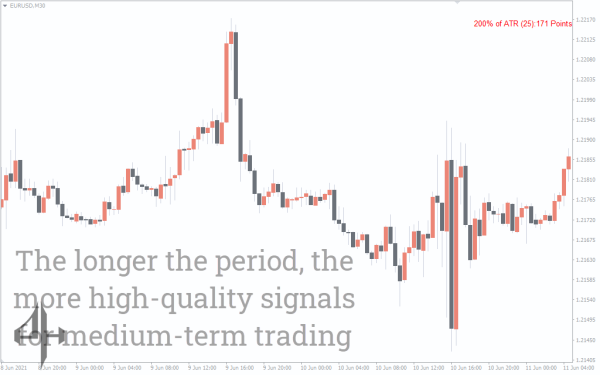
The market’s volatility is determined by the Average True Range Value Indicator. Stated differently, it illustrates the typical magnitude of price fluctuations for a specific item across time. On MT4, the average true range appears as a line that moves up and down the indicator pane when you utilise it. The market is more volatile when the Average True Range Value Indicator number is higher. Additionally, the market has less volume when the ATR number is lower.
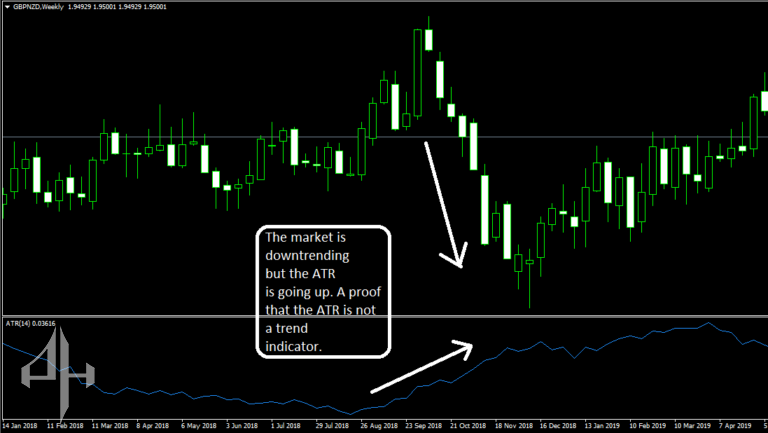
Attempting to trade trends using the ATR is a common mistake made by traders. They might as well be attempting to put square pegs into round holes, unfortunately. The market’s trend cannot be determined by the Average True Range Value Indicator. Even when the market is going in one direction, the ATR may slope in the opposite direction, as seen in the illustration below.
If you’re wondering how the ATR indicator is use, here are some common applications:
-
Traders use the ATR value to identify optimal entry points by assessing whether the market has sufficient activity for trading. It helps avoid entering stagnant or inactive markets.
-
The ATR can also assist in setting appropriate stop loss levels.
-
Additionally, the ATR may be use as an exit signal to help determine when to close a trade.
How Is the Indicator Calculate?
The Average True Range Value Indicator (ATR) measures the average range of price movement of an asset over a specified period. To calculate the true range, three values are consider for each period:
-
The difference between the current high and the previous low.
-
The difference between the current low and the previous close.
-
The difference between the current high and the current low.
The true range for each period is the greatest of these three values. The ATR is then calculate as the average of these true ranges over the chosen time frame.
The greatest of the true ranges is use by the ATR to determine the true range for that time period. Keep in mind that the ATR does not account for the number’s positivity or negativity. In terms of the volume telling indicator, negative 56 (-56) is equivalent to positive 56 (+56).
The ATR simply averages these values over a indicate period now that the true range formula for each period is known. For instance, the Metatrader 4 trading platform’s default ATR period is 14. In order to create a continuous line, the ATR computes the true ranges for the previous 14 candlesticks.
How to Trade Using the Average True Range Value Indicator
Many traders are keen to know how to apply the Average True Range Value Indicator effectively in their trading, and for good reason. The key lies in understanding how to implement the ATR indicator within your strategy.
Here are some ATR-based trading strategies:
-
Explosive Breakouts
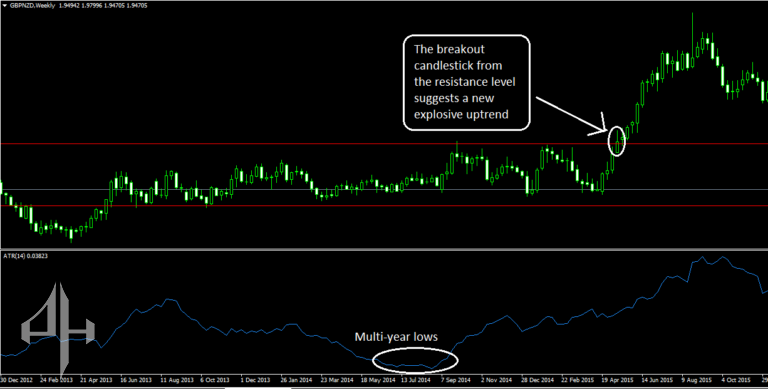
Market volatility fluctuates—sometimes it’s high, other times it’s low. This ATR strategy helps you capitalize on breakouts following periods of low volatility.
Start by applying the ATR indicator on a weekly chart and wait for it to reach multi-year lows, indicating the market is at its least volatile state with the ATR line near the bottom. Then, identify key support and resistance levels during this period. Once a breakout occurs beyond these levels, it may signal a strong move fueled by rising volatility.
The greatest of the true ranges is use by the ATR to determine the true range for that time period. Keep in mind that the ATR does not account for the number’s positivity or negativity. In terms of the volume telling indicator, negative 56 (-56) is equivalent to positive 56 (+56).
The ATR simply averages these values over a specified period now that the true range formula for each period is known. For instance, the Metatrader 4 trading platform’s default ATR period is 14. In order to create a continuous line, the ATR computes the true ranges for the previous 14 candlesticks.
 ]
]
The FXSSI support and resistance indicator is a reliable tool for identifying the key levels of support and resistance on your chart.
-
Setting Stop Losses
Have you ever seen the market dip just enough to trigger your stop loss before quickly reversing in the direction you expected? The ATR indicator can help you avoid this common frustration.
To use this strategy, check the current Average True Range Value Indicator value when entering a trade and multiply it by a chosen factor, typically 1.5, 2, or 3. Then, for a sell trade, add this value to the current price to set your stop loss; for a buy trade, subtract it.
Change your stop loss by the computed ATR at candlestick close to trail in trending markets.
(If you’re interest, there are also strategies for trading without stop losses entirely.)
-
Setting Take Profits
Since the ATR measures the average price movement over a set period, it can guide where to place your take profit orders.
For example, if the Average True Range Value Indicator on the GBPNZD daily chart reads 140 pips, you might set your take profit about 140 pips from your entry price. Combining this approach with other technical levels like swing highs/lows or support/resistance zones improves its effectiveness.
Who Is the Indicator Best For?
Because it doesn’t offer trend direction, the ATR indicator works for all forex traders and systems.
Overall, the Average True Range Value Indicator is not just as effective as other indicators but often better, as it helps keep your workspace clear for objective price analysis.
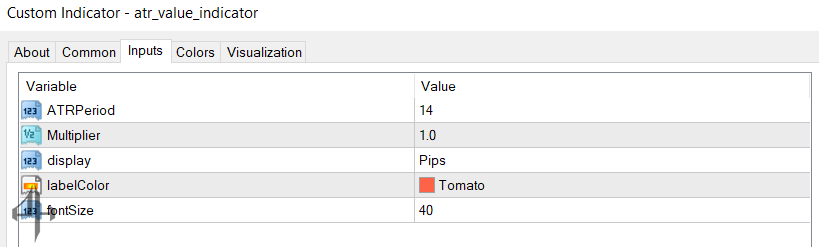
These are the MT4’s default settings for the atr value indicator.
-
-
-
ATR Period
Defines the number of candlesticks used to calculate the ATR values. The default is 14, meaning that on a daily chart, the ATR averages the true range over the last 14 days.Multiplier
Scales the original ATR value by the specified multiplier.Display
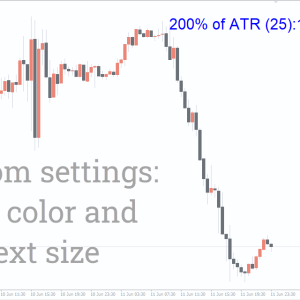
Controls how ATR values are shown on MT4, either in points or pips (with one pip equal to one-tenth of a point).Label Color
Allows you to select the color for the displayed text.Font
Sets the size of the displayed characters.
-
-