
- Description
- Reviews (0)
- Indicator Settings
Description
For MT4 traders, the Best Pullback Factor Indicator signifies when a trend retracement has ended and the trend will continue. Trend trading is the forex market’s most lucrative trading strategy. The goal of every forex trader is to follow the market’s trend. Lately joining a trend, however, could be too risky and lead to a trade stop-out.
As a result, many traders enjoy holding off on making trades until a trend retraces or pullbacks. Even though this seems straightforward, estimating the magnitude of a trend downturn is never simple. It can be challenging to pinpoint the precise retracement point, even when using Fibonacci retracement. However, forex traders can determine when the trend restarts by using the Best Pullback Factor Indicator.
The foundation
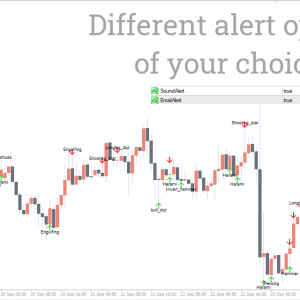
When a trend retracement comes to a conclusion, the Best Pullback Factor Indicator for MT4 alerts traders to the trend’s continuation. Traders can use this indication to enter the market at the optimal time by taking advantage of a trend downturn. With precise timing and accuracy, this indicator also enables traders to enter fewer high-risk bets.
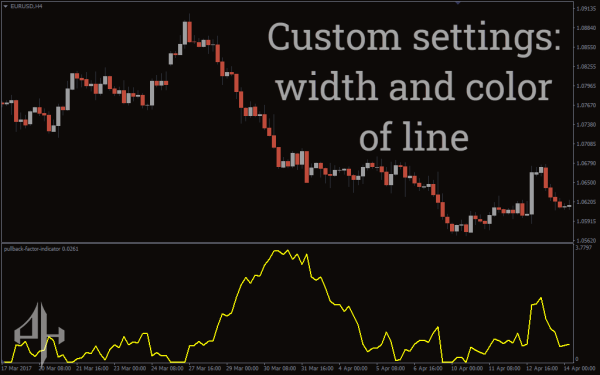
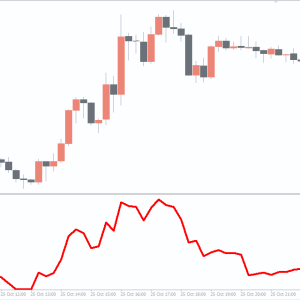
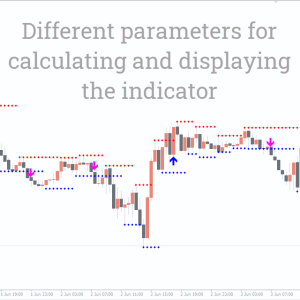
The Pullback Factor Indicator’s appearance on the chart is depicted in the diagram below.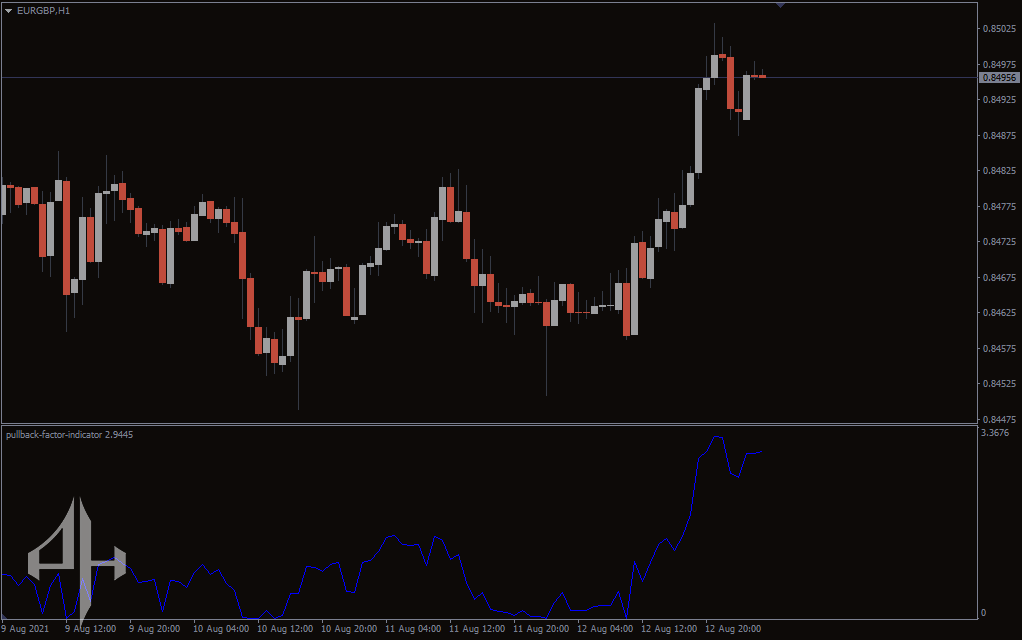
The Best Pullback Factor Indicator reading on the above GBP/USD H1 chart is 1.5738. Any readings above 1.5 indicate that there is a substantial likelihood that a retracement has concluded. These indicator readings range from 0 to 3.6.
For swing and position traders that employ hourly, daily, weekly, and monthly time periods, this indicator works best. However, scalpers should avoid using the Pullback Factor Indicator since it frequently results in fake-out transactions.
Before employing this indication, traders need to understand market structure and price activity. In actuality, forex novices with limited trading experience should not use this indication. When used with Fibonacci tools, this indicator will provide solid trade settings for best practices.
How to use the Best Pullback Factor Indicator
Traders ought to keep an eye on the Best Pullback Factor Indicator value. The trend downturn is nearing its conclusion when the indicator is over 1.5. As a result, traders should watch for a favourable entry point and the continuance of the trend.
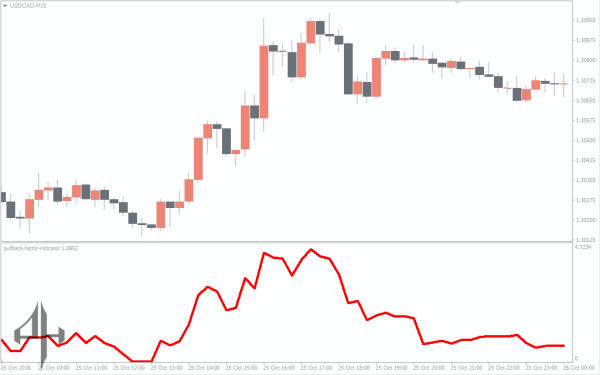
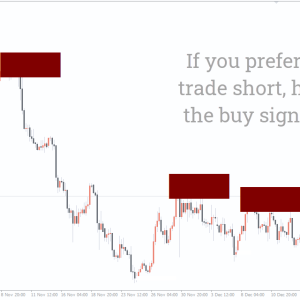
An example of how to use this indication is shown in the diagram below.
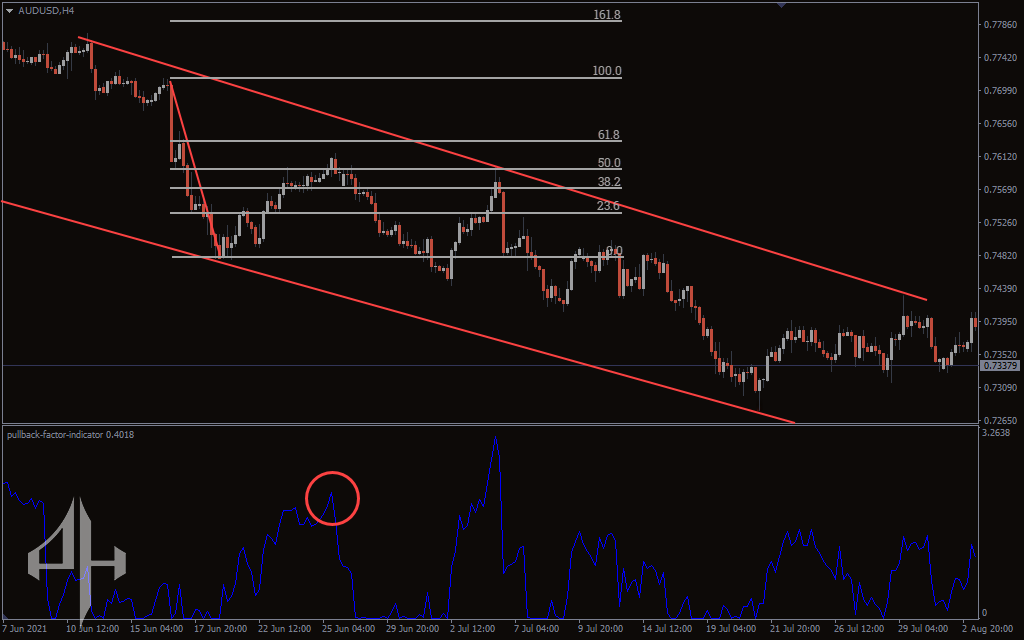
The trend lines on the AUD/USD H4 chart above make it abundantly evident that the market is in a downward trend. On June 21, 2021, the price decline occurs when it touches the channel’s lower trendline.
The price has retraced to the 61.8% Fibonacci level, according to this indicator’s integration of Fibonacci tools. The Best Pullback Factor Indicator value increased to 1.9 on June 25, 2021 (blue highlight). This indicates that the decline pullback is nearing its conclusion. The chart’s subsequent bearish engulfing candle confirms the resumption of the downward trend.
The bearish engulfing candle can be used to initiate a sell position right away. It is best to position the stop-loss just above the Fibonacci level of 61.8%. Additionally, the next lower trendline of the channel should be touched at the take-profit level. This trade will provide a low-risk, high-reward, ideal entry.
Conclusion
One helpful tool for determining when a trend retracement is complete is the Best Pullback Factor Indicator. It is the ideal technique for identifying an entrance trade with a high risk to reward ratio. When used in conjunction with Fibonacci tools, this indicator will produce the best results.
It is not recommended that novices use this indication carelessly. Lastly, hourly, daily, weekly, and monthly time intervals are the most effective for using this indication.
Be the first to review “Best Pullback Factor Indicator”
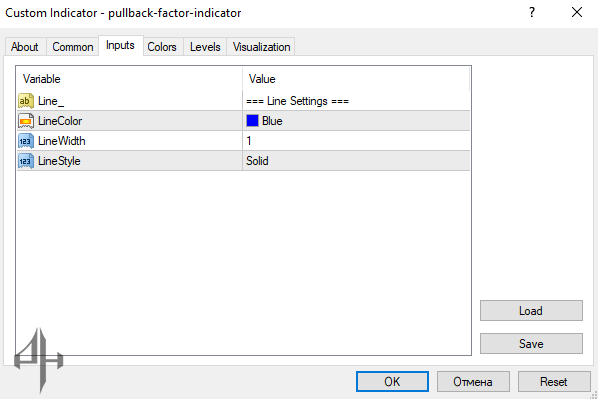
Pullback Factor Indicator – MT4 Settings Overview:
-
Line: Specifies the chart line on which the indicator is plotted.
-
Line Color: Defines the color of the indicator line.
-
Line Width: Sets the thickness of the indicator line.
-
Line Style: Determines the visual style (e.g., solid, dashed) of the indicator line.
Reviews
There are no reviews yet.