
The Bollinger Bands Color Indicator for MT5 is a top breakout and trend tool, visually highlighting volatility and key breakout signals effectively.
Updated:
One of the best trading indicators for monitoring market volatility is MetaTrader’s Bollinger Bands Color indicator. It is a priceless tool for evaluating market patterns, breakouts, and rebounds.
To gauge market volatility, the indicator bars are shown against the standard deviation. As price volatility rises and falls, they enlarge and contract.
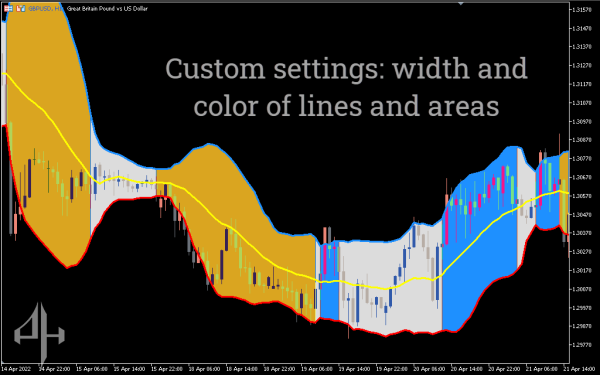
This color-coded MT5 indication, which includes an upper and lower band in addition to a moving average, is shown in the main chart window. Standard moving averages are used to determine the values of the upper and lower bands.
The indicator displays a range of market circumstances that are either avoidable or tradeable. For instance, an exponential expansion of the upper and lower bands is indicative of strong market volatility.
In contrast, a tight band indicates less market volatility. As a result, you will be aware of when to begin searching for exit or BUY/SELL possibilities.
Based on the data shown, the Bollinger Bands Color Indicator for MT5 assists you in determining profitable trading opportunities and exits.
Numerous trading techniques might incorporate the ubiquitous Bollinger Bands Color indicator. Trading market circumstances like trends, ranges, bounces, and breakouts is possible with it.
This makes it an appropriate trading tool for daily, intraday, and swing trading programs. Its ease of use and excellent trading accuracy will make it useful for both experienced and inexperienced traders.
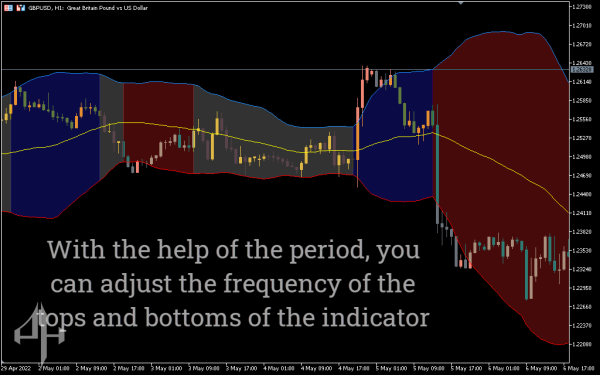
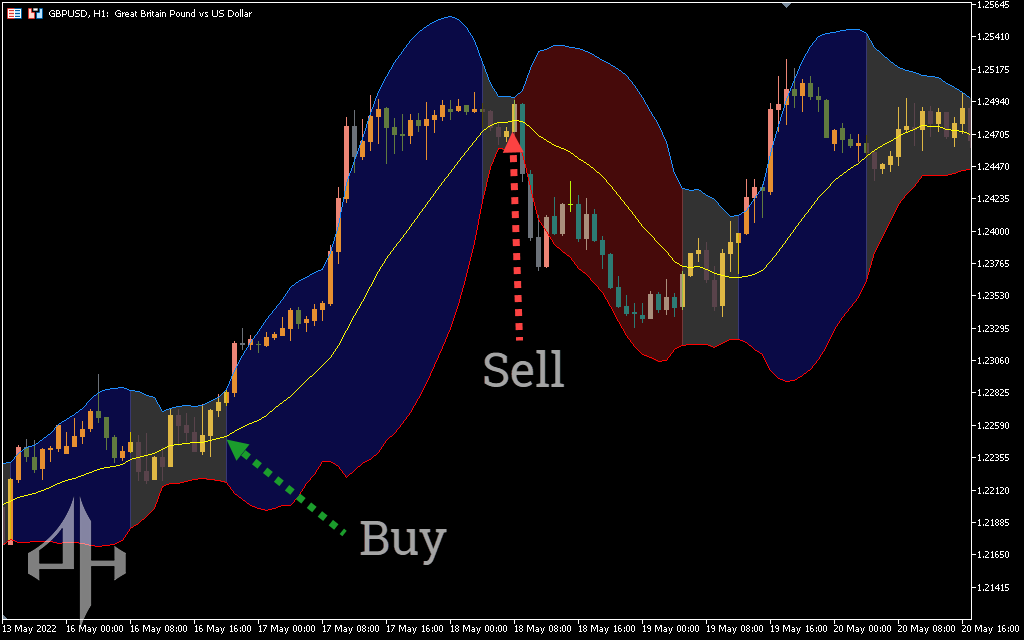
Depending on the mood of the market, the outer bands’ color shifts from blue to red. On the other hand, the light blue moving average is situated in the space between the bands.
When the upper and lower bands turn blue, it signals a buy, and when they turn red, it signals a sell.
The following illustrates how to use this indicator to trade profitably. The indicator’s behavior on the EUR/USD pair over the H4 timeframe is displayed in the above chart.
Wait for a candle, ideally a bullish one, to begin and close above the light blue moving average in order to obtain a highly probable bullish setup (BUY). In case the bars turn blue, enter a LONG position.
This also holds true for bearish setups (SELL). Watch for the opening and closing of a bearish candle below the light blue moving average. Additionally, before starting a SELL position, make sure the bars turn red.
You can improve your entry accuracy by using the Bollinger Bands Color Indicator for MT5. It creates the entry signal on the chart and performs all technical analysis in the background.
For optimal results, it is advised to utilize this indication in combination with price action or other uncorrelated indicators, even though it can be used alone. Try it out; it’s free to download.
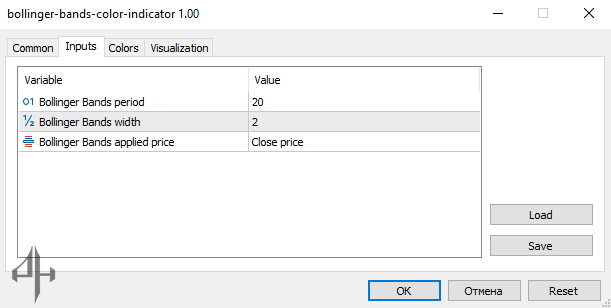
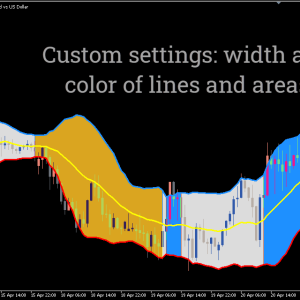
The indicator allows for limited customization options. Additionally, you must enable the “Allow DLL Report” option in the settings.
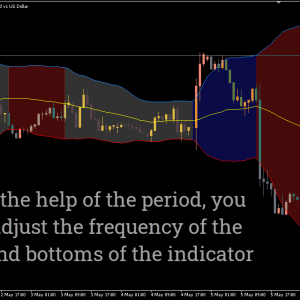
Period: The time frame used to calculate the volatility value.
Bollinger Bands width: The measurement of the Bollinger Bands channel’s width.
Bollinger Bands applied price: The price type on which the Bollinger Bands calculation is based.