

- Description
- Indicator Settings
Description
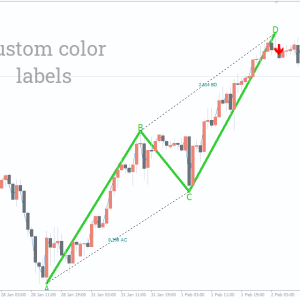
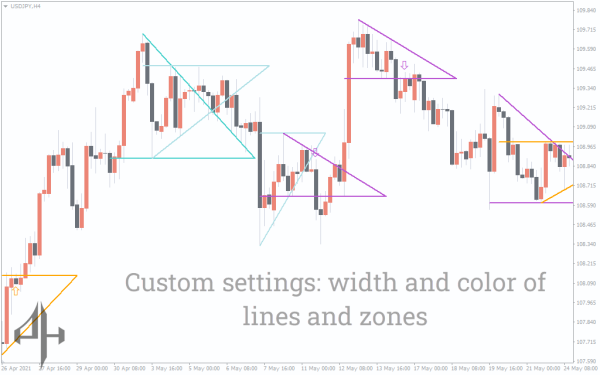
A straightforward MT4 indicator that provides information on market breakouts is the Breakout Pattern Indicator. To show the breakthrough, the indicator plots open triangles. Red and blue are the two colors that make up the triangles. Whereas the red triangle appears during a decline, the blue triangle appears during an uptrend.
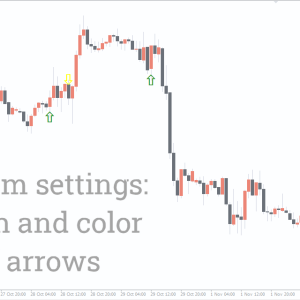
The indicator plots arrows on the chart in addition to triangles. The arrows’ appearance serves as confirmation. There is a blue arrow following the uptrend and a red arrow following the downward triangle. The direction of the trend is shown by the pattern’s formation. Traders can then adjust their positions appropriately.
You can use This Indicator on any timeframe because breakouts occur on all of them.
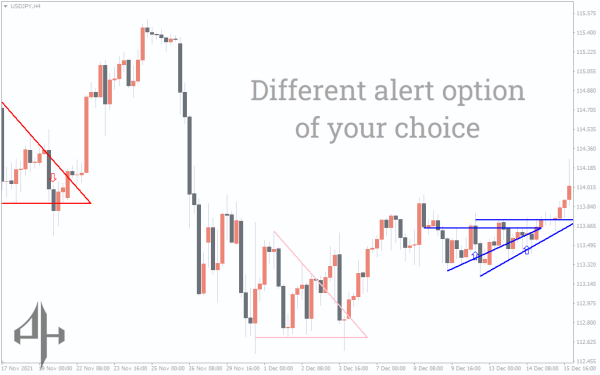
Breakout Pattern Indicator Signals for Buy and Sell
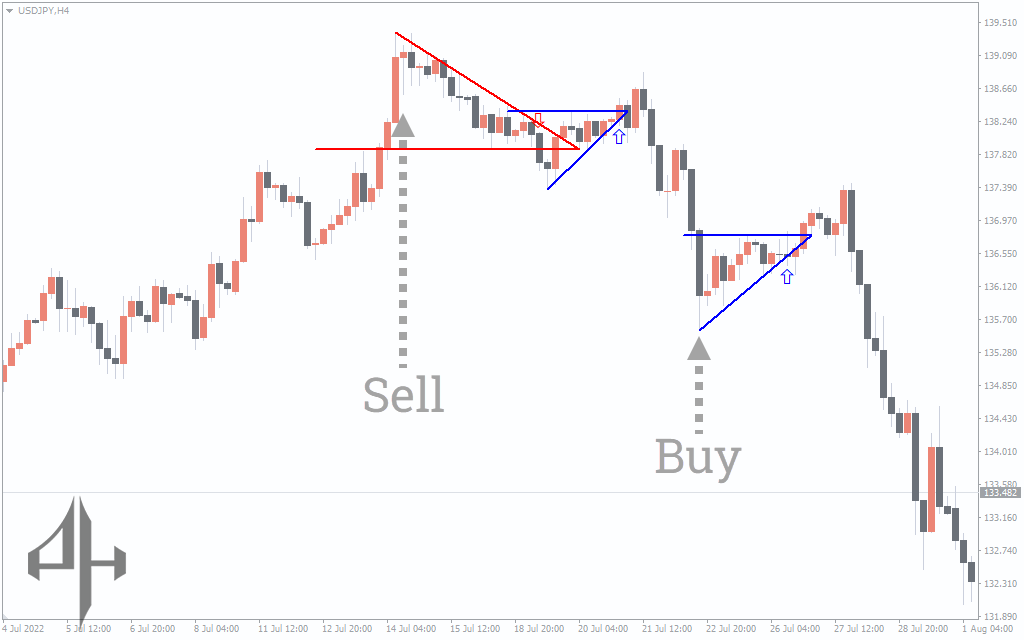
The USD/JPY H4 chart above displays the indicator’s BUY and SELL signals. Traders must search for the triangles in order to identify the BUY and SELL signals. The red triangle is a sign that traders should take short positions when it shows up during a decline.
The blue triangle, on the other hand, signals that you should enter long positions when it appears during an uptrend. As previously said, the emergence of the arrows further supports the direction of the trend.
What is the best Breakout Pattern Indicator?
Each breakout indication provides information about the patterns of the breakthrough. Among the most well-known is the RSI. To identify important breakouts, you can also use the Breakout Pattern Indicator.
What is the operation of the breakout indicator?
Triangles are plotted by this Indicator to show the direction of the trend. The indicator can be used to identify bearish and bullish trade settings, and you can adjust your holdings accordingly.
Conclusion
To ascertain the direction of the trend, the Breakout Pattern Indicator makes reference to breakout triangles. Triangles can be used by traders to position themselves. Additionally, the indicator is available for free download on our website.
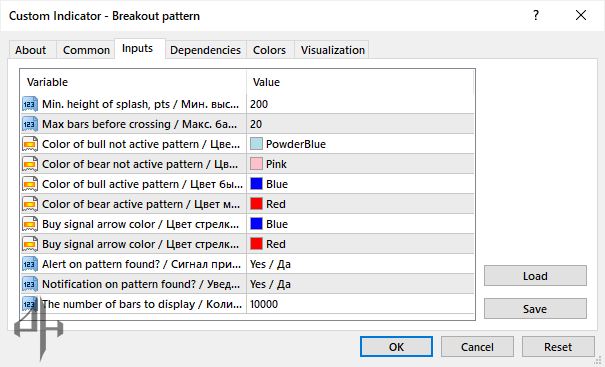
Min. Height of Splash, pts: Default value is 200, determining the minimum height for the triangles.
Max. Bars Before Crossing: Default value is 20, indicating the maximum number of bars before the crossing occurs.
Color of Bull Not Active Pattern: Default color is PowderBlue for the inactive bull pattern.
Color of Bear Not Active Pattern: Default color is Pink for the inactive bear pattern.
Color of Bull Active Pattern: Default color is Blue for the active bull pattern.
Color of Bear Active Pattern: Default color is Red for the active bear pattern.
Buy Signal Arrow Color: Default color is Blue for the Buy signal arrow.
Sell Signal Arrow Color: Default color is Red for the Sell signal arrow.
Alert on Pattern Found?: Default setting is Yes, it alerts when a new pattern is created.
Notification of Pattern Found?: Default setting is Yes, it notifies when a new pattern is created.
Number of Bars to Display: Default value is 10,000, indicating how many bars the indicator will display.