- Description
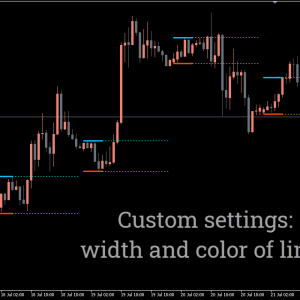
- Indicator Settings
Description
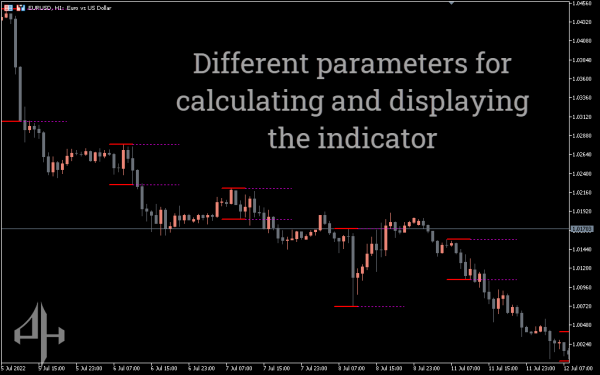
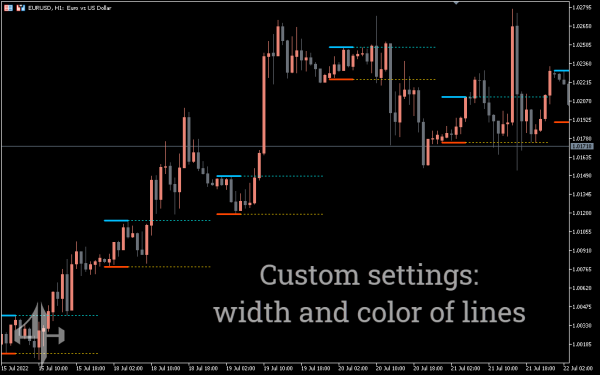
Support and resistance lines are automatically drawn on the price chart by the MT5 Breakout Zones Indicator in response to price movement. When the price breaks above the support line, it is deemed bullish. In a similar vein, a bear market occurs when prices move below the support line. Forex traders can then use support and resistance to manage their current transactions or purchase and sell in response to bullish and bearish market fluctuations.
Both novice and seasoned forex traders can benefit from the indicator. New traders are able to predict possible price movement during the day, create trading methods, and recognize market trends. If there is a price zone breakout, experienced forex traders can create intricate trading plans.
To find a breakout zone for the day, forex traders can position the indicator on any intraday price chart. Additionally, traders may quickly install the indicator after downloading it for free.
The MT5 Trading Signals Breakout Zones Indicator
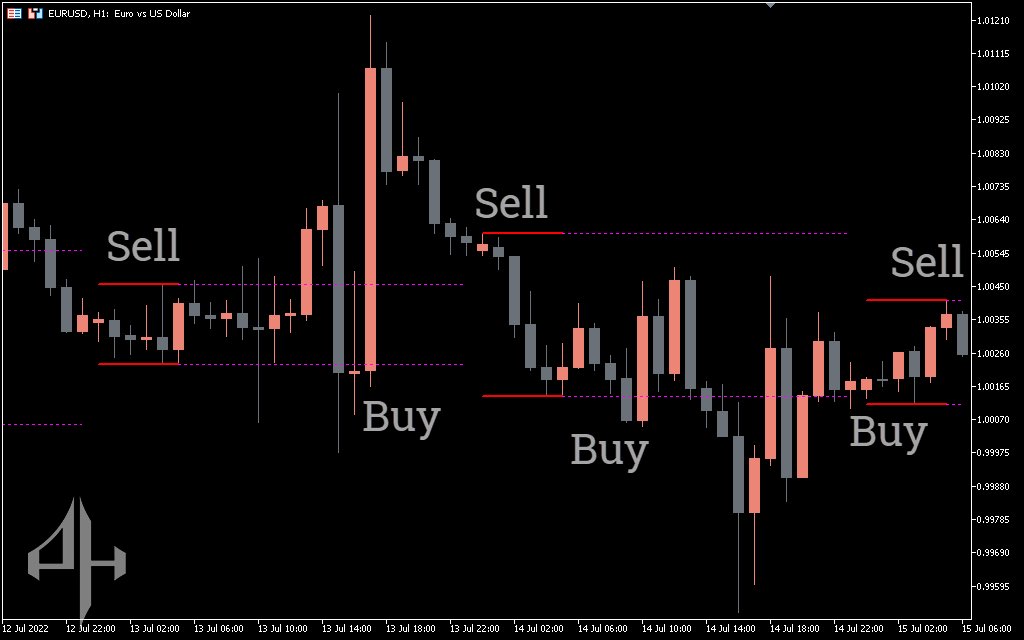
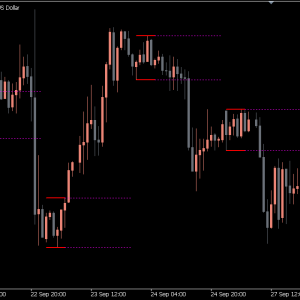
The MT5 breakout zones indicator is active in the EURUSD H1 candlestick chart above. The indicator displays red lines for support and resistance. To trade successfully in the breakout zone, technical forex traders need to follow the support and resistance breakout trading guidelines.
A possible bullish trend is indicated if the price breaks the resistance line and rises above the breakout zone. Forex traders should therefore set a stop loss below the last swing low and enter the markets with a BUY position.
Forex traders should employ other techniques to identify the optimal objective because the indicator does not indicate a potential profit target. In the long term, a take profit larger than a 1:2 risk-reward ratio will yield favourable outcomes.
Similarly, the price would move lower if it breaks through support and travels more slowly than the breakout zone, thereby breaking through the breakout zone. Traders might use a stop loss above the previous swing high to initiate a SELL trade.
If the trader confirms the breakout after the candle closes, breakout trading will yield the best rewards. Further evidence of the breakout is provided by the candle closing above the resistance level or below the support line. However, it can backfire if forex traders enter the market too quickly during the breakout candle.
In conclusion, the ability of the trader to recognise and validate a breakout utilising reliable technical procedures and price action is the primary determinant of the trading outcomes of the Breakout Zones Indicator for MT5. Additionally, traders should be aware that breakouts are typically accompanied by a rise in trading volumes.
Conclusion
For trading support and resistance levels, the Breakout Zones Indicator for MT5 is a crucial tool. To ascertain the possible direction of the market, forex traders search for a zone and watch for a breakout. But traders need to be ready for a lot of false breakouts. To verify the breakout, breakout traders should make use of extra indicators like trendlines and channels. The price action during the breakthrough, however, is the most crucial factor.
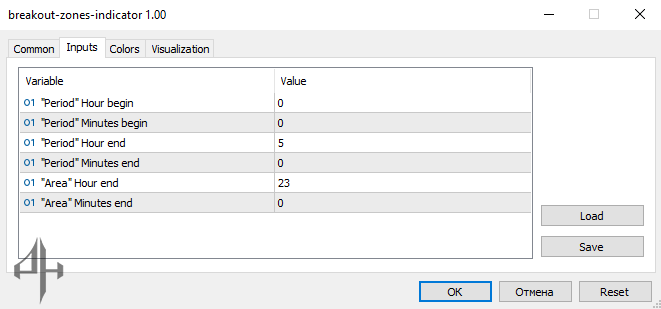
Period Hour Begin: Starting hour for calculating the indicator lines.
Period Minutes Begin: Starting minutes for calculating the indicator lines.
Period Hour End: Ending hour for calculating the indicator lines.
Period Minutes End: Ending minutes for calculating the indicator lines.
Area Hour End: Ending hour for calculating the indicator’s dotted lines.
Area Minutes End: Ending minutes for calculating the indicator’s dotted lines.