- Description
- Indicator Settings
Description
One momentum-based technical indicator that can identify momentum reversals and produce alerts pointing to them is the Buy Sell Signal Indicator.
All of the subtleties and quirks of the Buy Sell Signals indicator for MT4 will be covered in this guide.
What is Buy Sell Signal Indicator?
One of the most crucial signs that the price is about to move significantly in one way is momentum. The Buy Sell Signal Indicator can be an extremely useful tool for identifying these momentum reversals.
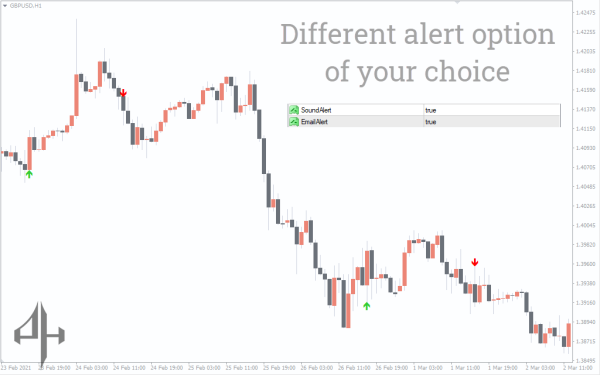
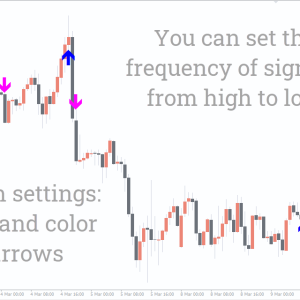
The indicator displays an arrow pointing upward when it detects a bullish momentum reversal and a downward arrow when it detects a negative momentum reversal.
Whenever it detects a possible momentum reversal indicator, it also sends out emails and notifications.
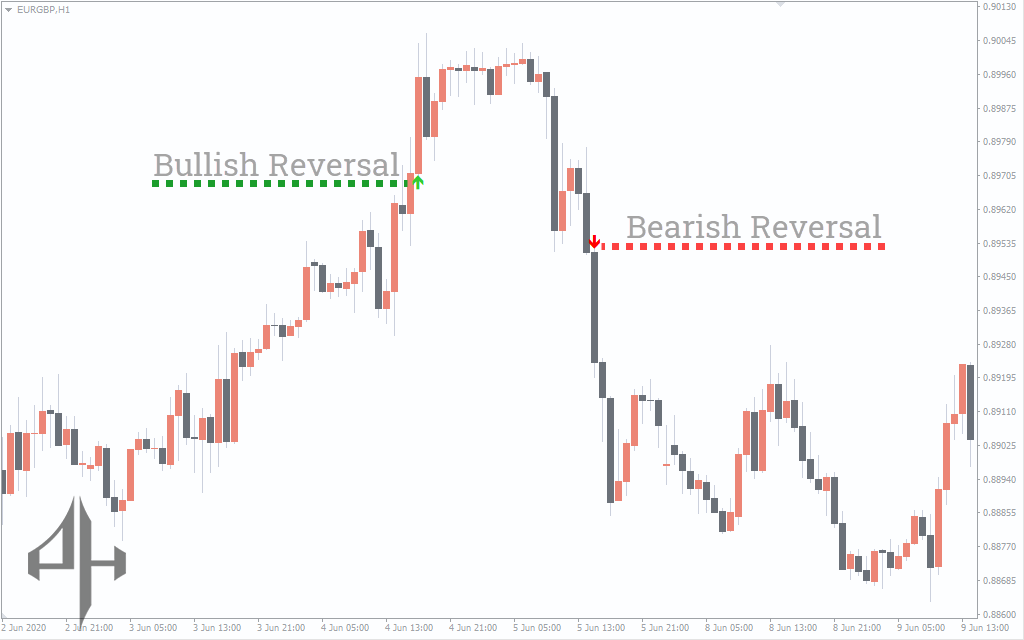
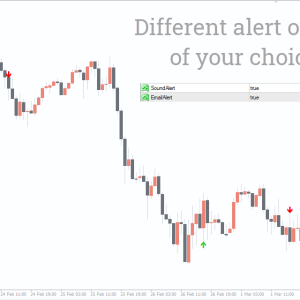
The Buy Sell Signal Indicator, as shown on the chart, tends to identify possible highs and lows where you should set your stops in addition to capturing trends. The indicator works best when the markets are trending, according to a quick glance at it.
However, the signal can result in large losses during a brief sideways consolidation period. This makes the signal comparable to other technical indicators that seem to work similarly, including the parabolic stop and reverses indicator.
All periods are covered by the buy sell signals indicator, which makes it possible to use a variety of technical trading techniques, including multiple time frame analysis and combining this approach with other trend-following strategies.
How to trade the Buy Sell Signal Indicator?
As said before, this indicator is an excellent momentum reversal indication indicator. It is most effective when used as a signal to enter a wider trading strategy.
It is also possible to trade alongside a long-term trend using these short-term momentum indications. Traders can simply use the arrows as an entrance signal to confirm their transactions.
It calculates how many bars there are on a chart and how far apart they are. Based on the information provided, the indicator creates an arrow that suggests whether to buy or sell.
In essence, it uses historical data to forecast the direction of the trend in the future.
From here, traders can choose the risk margin they are ready to accept and determine the best places to set their stops (stop losses) in order to minimize any possible losses.
Additionally, it provides a basis for traders to make decisions about buying or selling depending on the trend’s direction and the indicators that arise.
Buy Sell Signal Indicator trading strategy
This Indicator is versatile and can be used in any timeframe, allowing traders to implement various technical strategies, such as the multiple timeframe analysis.
Buy setup
-
Identify the upward arrow on the chart.
-
Wait for the price bar to turn bullish.
-
Place a stop-loss near the recent low.
-
Exit when the trend changes.
Sell setup
-
Identify the downward arrow on the chart.
-
Wait for the price bar to turn bearish.
-
Place a stop-loss near the recent high.
-
Exit when the trend changes.
conclusion
The Buy Sell Signal indicator provides clear entry signals for both short and long trades. It doesn’t require complex analysis — simply recognize the green and red arrows.
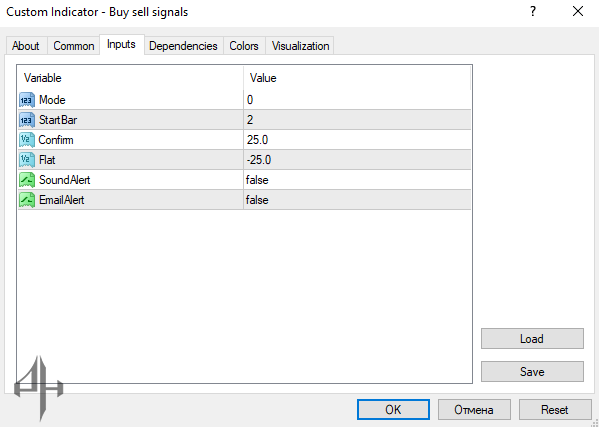
The indicator includes the following settings:
-
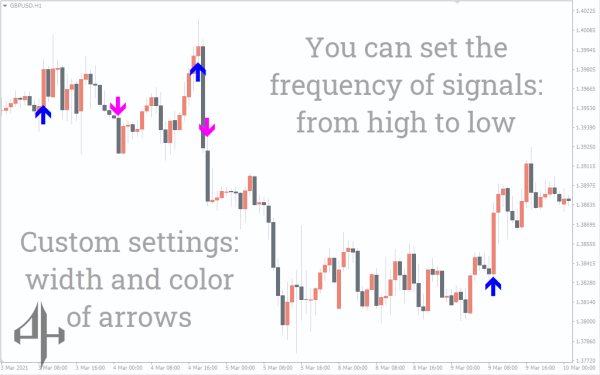
Mode: Adjusts the sensitivity of the indicator; a lower value increases sensitivity.
-
StartBar: Sets where the indicator begins counting bars for a potential reversal.
-
Confirm: Displays the distance between two reversals.
-
Flat: Shows the distance between the two reversals during a flat market.
-
SoundAlert: Alerts you with sound whenever a new arrow appears on the chart.
-
EmailAlert: Sends an email notification about a potential reversal.