- Description
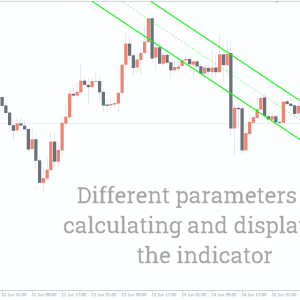
- Indicator Settings
Description
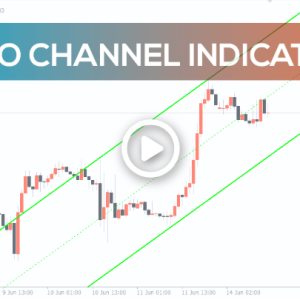
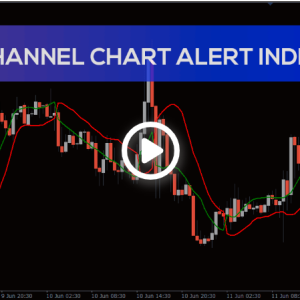
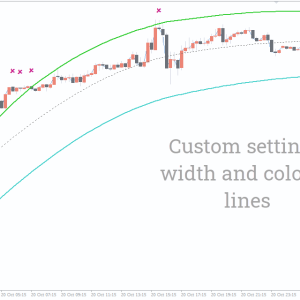
The CAP channel trading indicator is used for channel trading, as the name suggests. The price typically falls within a channel that is bounded by an upper and lower line when it employs an envelope method. Whereas the lower channel represents an oversold situation, the upper channel represents an overbought situation.
Because the indicator is volatility sensitive, it evaluates an instrument’s daily price variations to identify supply and demand regions. You can use this indication to determine when to enter the market. It also aids in deciding whether to hold onto or completely leave the market. Trend reversal points are indicated by the indicator post arrow signals, which allow traders to seize trading chances.
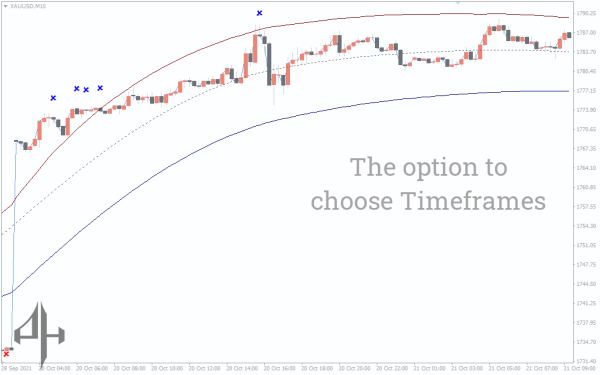
Cap Channel Trading Indicator can be used to trade any instrument or currency pair. Additionally, the indicator performs flawlessly on timescales of 15 minutes or more for both short-term and long-term trading strategies.
How to Open Buy and Sell Signal Using the Cap Channel Trading Indicator
Buy Signal:
-
Wait for the price to find support at the lower band.
-
Enter a buy trade when a red cross appears, ideally at the close of a bullish candle or candlestick pattern.
-
Place your stop loss just below the recent swing low.
-
Exit the trade when the price reaches the upper band or when the indicator shows a blue cross.
Sell Signal:
-
Wait for the price to find resistance at the upper band.
-
Enter a sell trade when the indicator shows a blue cross signaling a market reversal.
-
Place your stop loss just above the recent swing high.
-
Exit the trade when the price touches the lower channel line or the indicator shows a red cross.
An Example of a Real Market
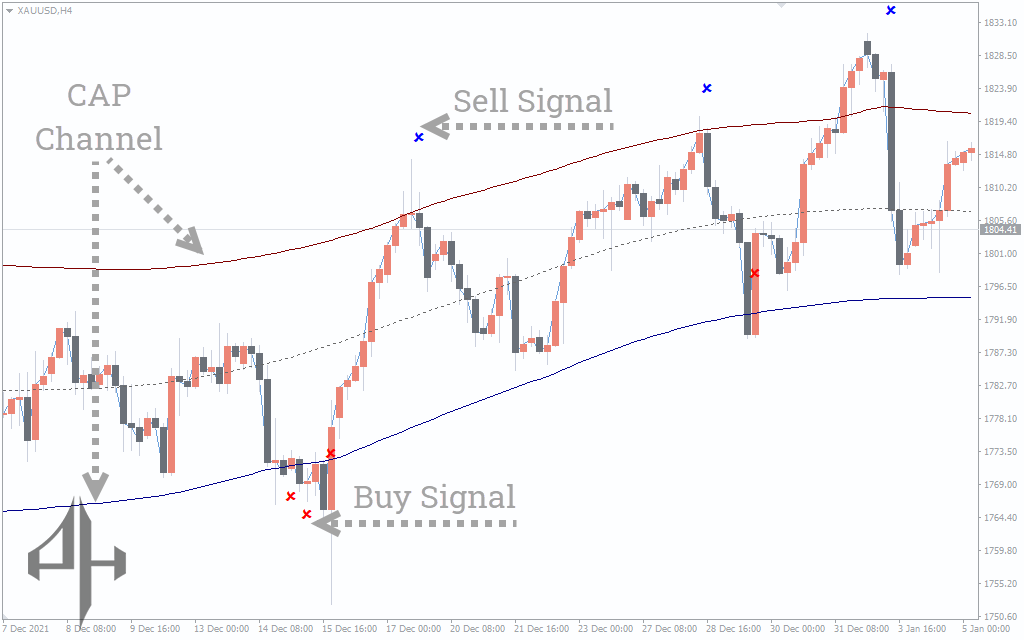
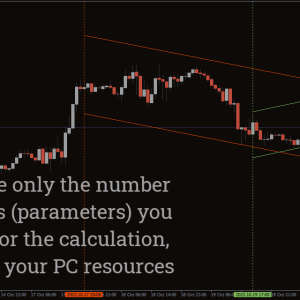
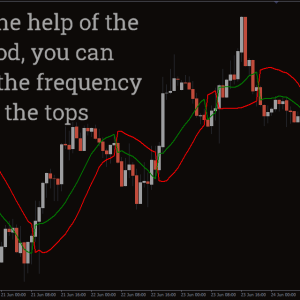
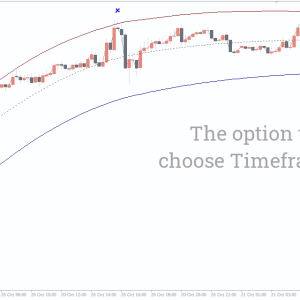
The gold price change in relation to the US dollar is displayed on the chart. Observe how the price moves in accordance with the red and blue lines that define the Cap Channel Trading Indicator. The blue line represents an oversold level, and the red line represents an overbought area.
An imminent downturn is indicated when the price crosses the red line. As seen in the image, the indicator actually posts a blue cross. In a similar vein, the price reaching the blue line—an oversold area—signals a buy. This suggests that an upswing reversal is imminent for the price. The indicator posts a red arrow to indicate a buy signal.
Conclusion
CAP For traders that employ the channel trading method, a channel trading indicator is the perfect instrument. Cap Channel Trading Indicator plots an envelope that the price typically falls within and maps the price charts while accounting for price volatility. All you need to do as a trader is watch for the price to cross the channel line, post a red or blue cross, and then get out when the indicator crosses the channel line on the other side. Each and every trader ought to think about utilizing this product.
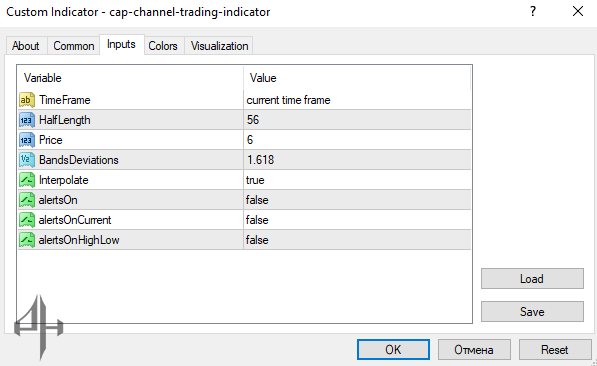
Time Frame: Allows you to select the ideal timeframe for your trading strategy.
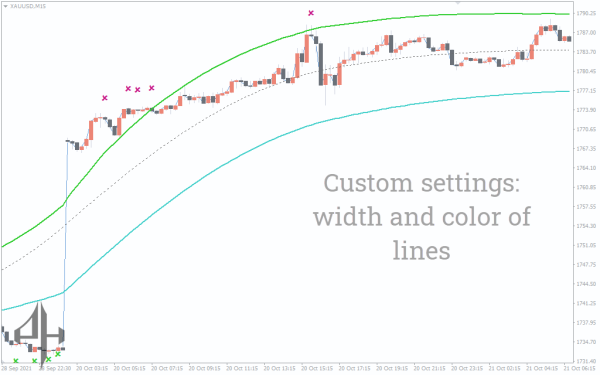
Half-Length: Sets the value for the middle line of the channel.
Price: Defines the price used for calculating the band’s deviation.
Interpolate: When set to true, interpolation is applied to create smoother indicator lines.
Bands Deviation: Enables interpolation for the channel lines.
Alerts On: Toggles alerts on or off.
Alerts on Current: Enables alerts based on the current bar.
Alerts on High Low: Activates alerts when price reaches highs or lows.