- Description
- Indicator Settings
Description
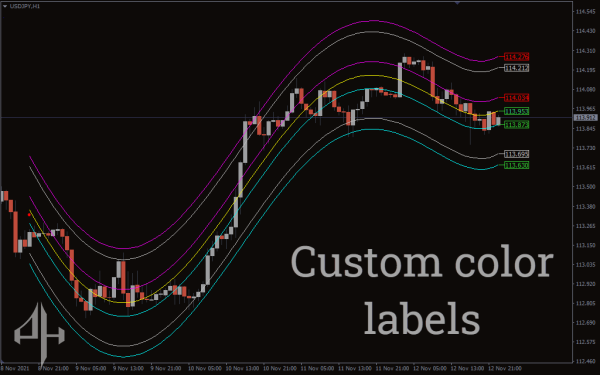
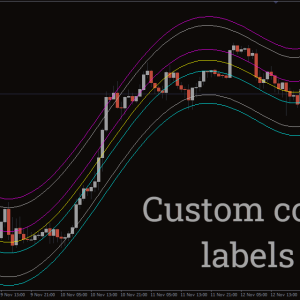
The overbought and oversold levels of a trading instrument are shown by a sequence of lines plotted by the Center Of Gravity V3 Indicator for MT4. Additionally, a green central line that serves as a center of gravity is plotted by the indicator. The indicator predicts that the price will turn around and move in the direction of the center of gravity line if it reaches extremely high or low levels of overbought or oversold conditions. Therefore, at extreme oversold and overbought levels, forex traders can predict bullish and bearish market reversals and BUY or SELL accordingly.
Both novice and seasoned forex traders can benefit from the indicator. Using the overbought and oversold levels, novice traders can determine the ideal take-profit goal as well as entry points. Expert forex traders can create trading methods to enter in a shorter time frame by using the technical trading signals from the longer time frame. The indicator is very simple to install and available for free download.
MT4 Trading Signals’ Center Of Gravity V3 Indicator
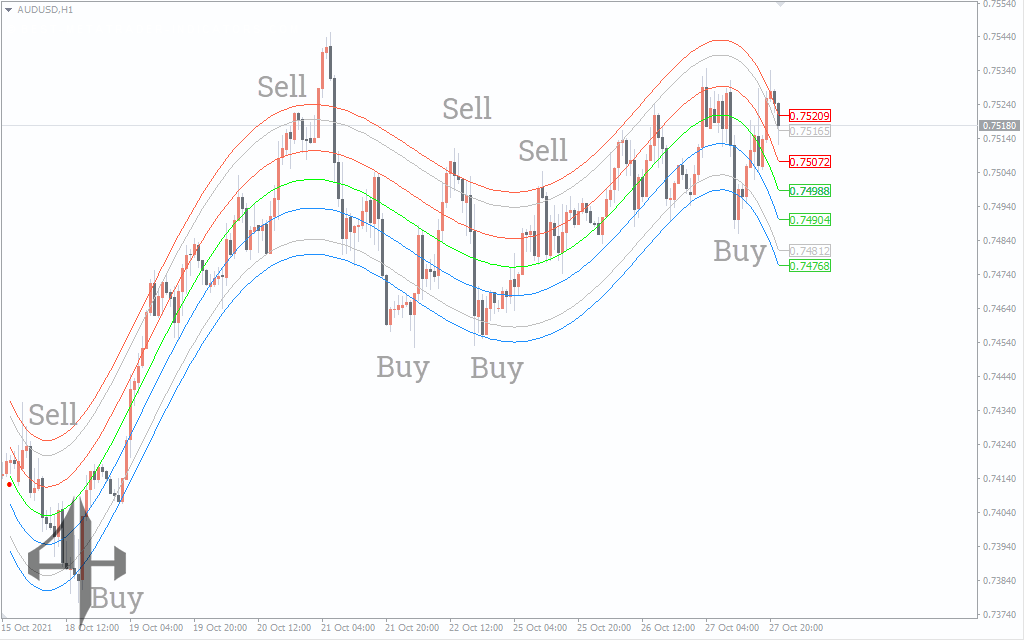
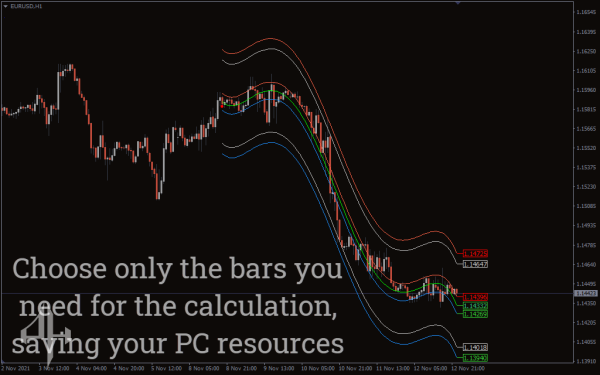
The Center Of Gravity V3 Indicator is active in the AUDUSD H1 price chart above. The indicator displays the BUY zone as blue and the SELL zone as red. Additionally, the optimum Overbought and Oversold conditions for an entrance are indicated by the GRAY lines on either side. Additionally, the center of gravity line is the GREEN middle line.
if the price declines, hits the BLUE line, and enters the extreme oversold zone beneath the GRAY line. It indicates that a bullish turnaround is imminent and that the prices are oversold. Forex traders might therefore initiate a BUY trade with a stop loss below the swing low from the previous session. Since the green middle line indicates the center of gravity, it is the optimal take profit.
Likewise, when the price hits the RED line after reaching the highly overbought area above the GRAY line. Forex traders can anticipate a price reversal and a bearish outlook since it signals that the prices are overbought. Thus, a SELL position is one way for technical traders to enter the market. Above the previous swing high is the ideal stop loss. However, as the indicator predicts that the price will always return to the Center Of Gravity V3 Indicator line from an extremely overbought condition, the optimum take profit is the green middle line.
The indicator performs admirably on daily, weekly, and monthly price charts in addition to all intraday charts. Traders can, however, use the lower time frame signals to determine the optimal entry points and the higher time frame zones’ trading signals for guidance.
Conclusion
A dynamic overbought and oversold indicator is the Center Of Gravity V3 Indicator for MT4. Additionally, the indicator’s take-profit levels give forex traders comfort when trading. Overbought and oversold conditions serve as the foundation for the forex trading signals. Price action is therefore necessary for technical traders to validate the BUY and SELL trading signals.
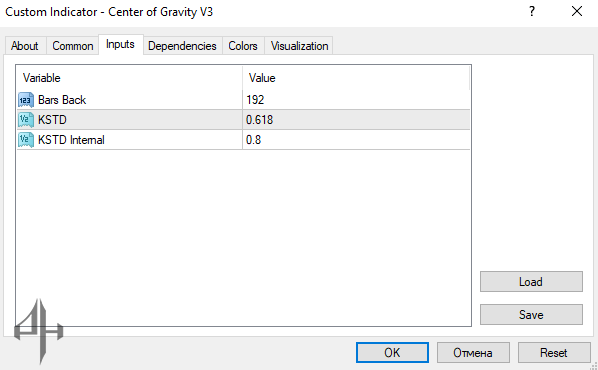
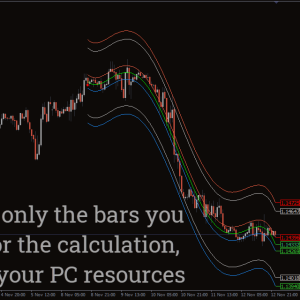
Bars Back: The number of historical bars used to apply the indicator.
KSTD: The standard deviation value.
KSTD Internal: The standard deviation used internally within the indicator’s calculations.