Chart Projection Indicator, Gain a Competitive Edge

This fantastic Chart Projection Indicator shows you on the currency chart where the price will go and reverse! This indicator only works on MT4 charts.

Updated: 

Description

What is most desired by forex traders? to be aware of two things:

  • Which trend—bearish or bullish—will be dominant in the near future? to create a suitable situation.
  • When will a bullish or bearish trend end? to profitably close a position.

Both questions are addressed by the MT4 Chart Projection Indicator.

When you incorporate the indication into your price chart, you will see the following:

Chart Projection Indicator

The prior price activity is shown by the green ZigZag line.

The anticipated price movement is represented by the orange ZigZag line.

The anticipated support and resistance zones are shown by the green rectangles.

The indicator indicates that the price should decline from the resistance zone and drop to 1.0151 in the scenario shown on the above chart.

Does the indicator only depict the future? Fully automated? Fantastic! How can that be?

Workings of the Chart Projection indicator

The piece is predicated on two ideas:

  • traditional technical ZigZag indicator;
  • optical methods that operate automatically;

The price chart is divided into a series of bullish and bearish waves by the ZigZag indicator.

The bullish and bearish waves are then analyzed using optical algorithms, which identify so-called Points of Interest (POIs) and utilize them to forecast future market movements.

The characteristics of the optical algorithms are kept a secret by the indicator’s creator, Lorentzos Roussos. That’s his right, then. However, he provides seven free variations of optical algorithms:

  1. Simple
  2. Simple Specific
  3. Flexible Specific
  4. Longscope Simple
  5. Longscope Flexible
  6. Complex
  7. S+R
  8. Original

Which MT4 indicator is the best?

Because of its benefits, the Chart Projection indicator for MT4 can undoubtedly be the ideal forex indicator for you.

  • It merely indicates the price of the future. Nothing needs to be analyzed by you!
  • Any FX chart can use it.
  • According to the author, optical algorithms view charts similarly to how humans do. The indicator simulates human behavior in this way.
  • It shows you where to make money, which lets you manage the risks.
  • The relative strength of the currency or a trend can be ascertained using the Chart Projection indicator.
  • Its UI is really lovely!

The Chart Projection indicator for MT4 has several excellent features, including:

  • the capability to plot Heiken Ashi charts, Renko charts (click the button denoted by the number 1), and other charts;
  • the capacity to determine a currency’s relative strength;
  • the capacity to determine the strength of a trend;

However, there are drawbacks to the indicator:

  • Occasionally, the indicator By the way, the author refers to it as an algorithmic oddity rather than a defect.
  • Checking the past is difficult. In the regular MT4, the indicator is not functional.

It is evident from the many positive reviews that the Chart Projection indicator is worthwhile, so download it without hesitation. It’s free!

Buy Signal Projection Chart

The purchase signal on the GBPUSD forex chart below should activate shortly.

How to trade:

  • Hold off until the price hits the orange ZigZag line’s lowest point.
  • Take a long position.
  • Set a stop-loss beneath the area of support.
  • Put a take-profit around the orange ZigZag line’s upper end.

Keep an eye on the ratio of risk to profit. At least 1:2 should be used.

Sell Signal Projection Chart

An illustration of a sell signal in the USDCAD market is displayed in the chart below.

How to trade:

  • The price is close to the orange line’s upper point, which indicates that a short position should be opened.
  • Put the take-profit close to the orange’s base.
  • Either wait for the next setup or reduce the stop-loss till the risk:reward ratio is 1:2 because the resistance zone is too high.

Conclusion

The indicator’s primary function is to predict future price movement, as its name suggests. It does this by using “secret” optical methods and the traditional technical indication ZigZag.

The Chart Projection indication is another useful tool:

  • for automatically determining the zones of resistance and support;
  • definition of trend strength;
  • creation of unconventional price charts.

The Chart Projection indicator is a great tool for new Forex traders because it is very straightforward to use, even for risk calculation. Of course, it cannot magically forecast the future.

Practice on a demo account before utilizing the Chart Projection indicator. Before you risk actual money, make sure that the indicator estimates are accurate in the majority of circumstances.

The Chart Projection Indicator for MT4 is available for free download and installation.

Reviews

There are no reviews yet.


Be the first to review “Chart Projection Indicator, Gain a Competitive Edge”

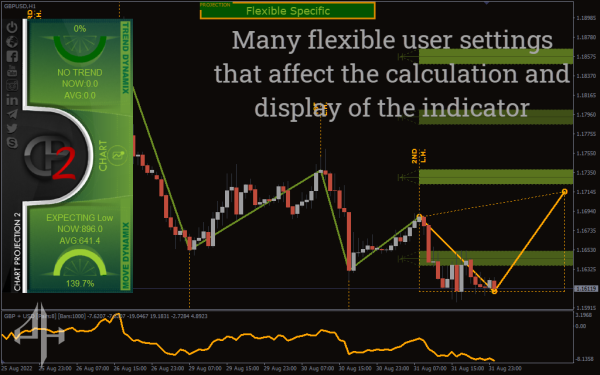
Most of the parameters determine how the indicator appears on the price chart.

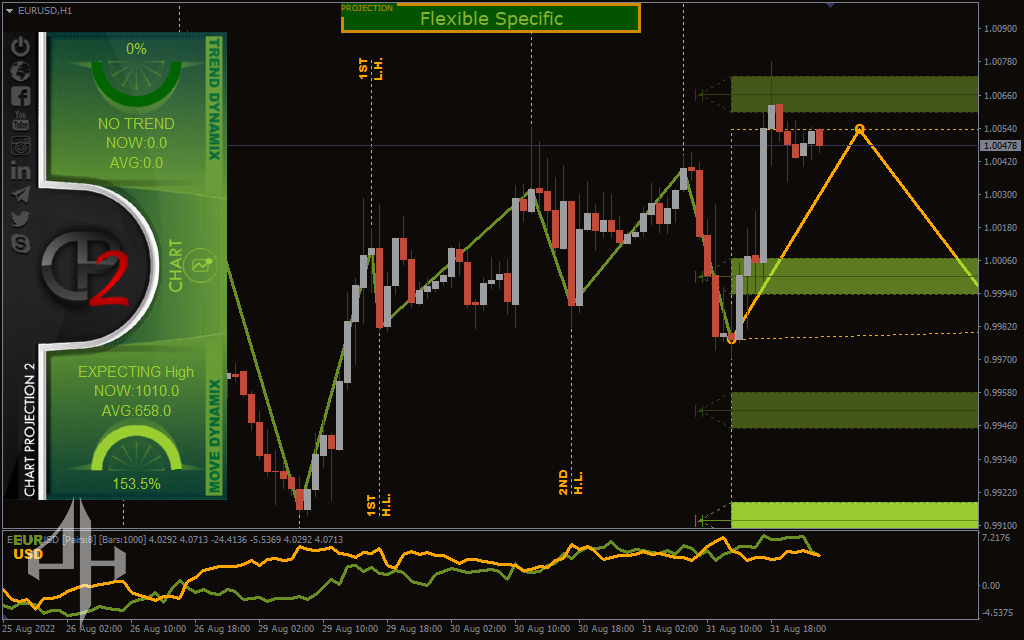
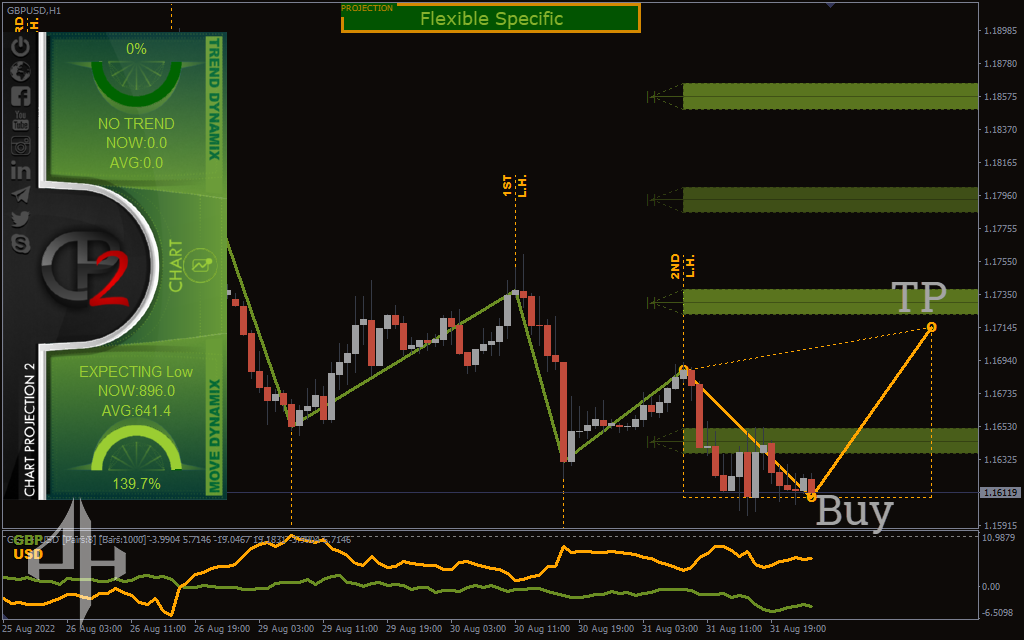
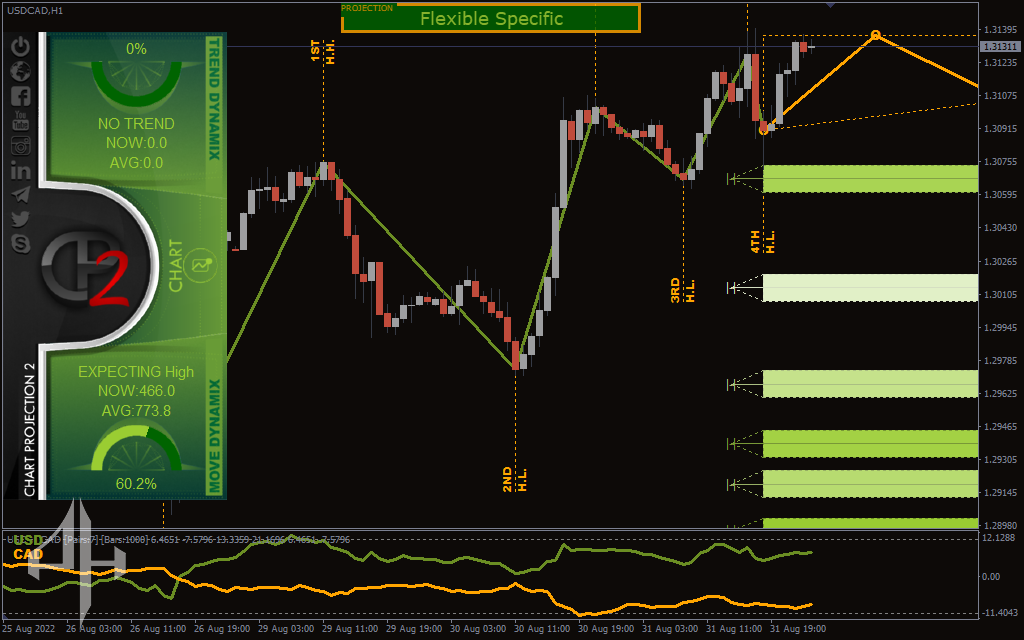
Show Projection / Left Panel / Currency Strength / Support Resistance / Trend Steps: These toggles control whether the respective indicator elements are visible on the price chart.

Price Used for Calculation: The default option is Close Price, but you can select from Median Price, Typical Price, or other available choices.

Capture Scale / Method Settings: Unfortunately, the author hasn’t provided detailed explanations for these settings. You may need to experiment to understand how they impact the indicator signals. It’s recommended to start with the default settings.

Next, we have settings for displaying:

  • The oscillator for currency strength

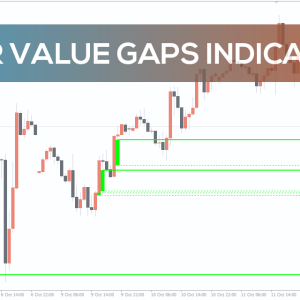
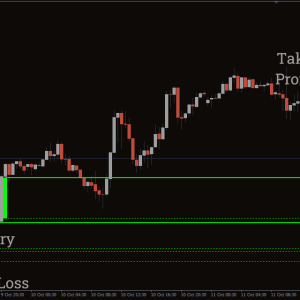
  • Support and resistance zones

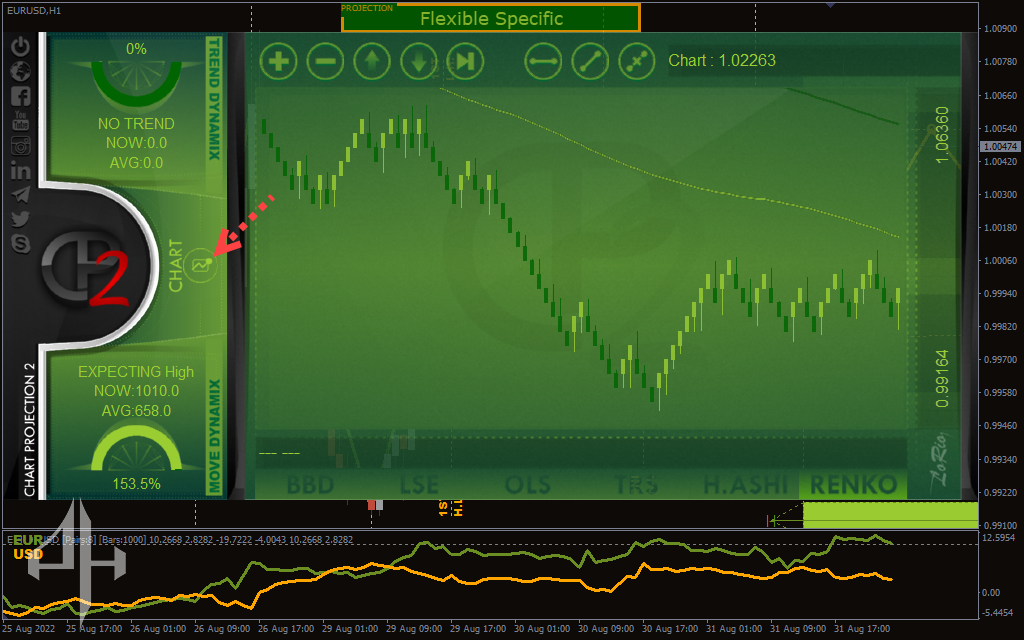
  • Non-standard charts, such as Renko

  • The control panel on the left side of the price chart

Related Products