- Description
- Indicator Settings
Description
The traditional RSI indicator, the Relative Strength Index, has been tweaked to become the Color RSI indicator for MT5. Price signals as well as BUY and SELL trading signals have been added to the chart. Furthermore, the oscillator’s color has been modified to represent the market’s overbought and oversold conditions. In order to trade successfully, forex traders can utilize the oscillator’s color BUY and SELL signals. Both novice and seasoned forex traders can benefit from the indicator. Additionally, the indicator performs admirably on daily, weekly, and monthly charts in addition to all intraday price charts. Additionally, the indicator is available for free download and simple installation for forex traders.
MT5 trading signal color RSI indicator
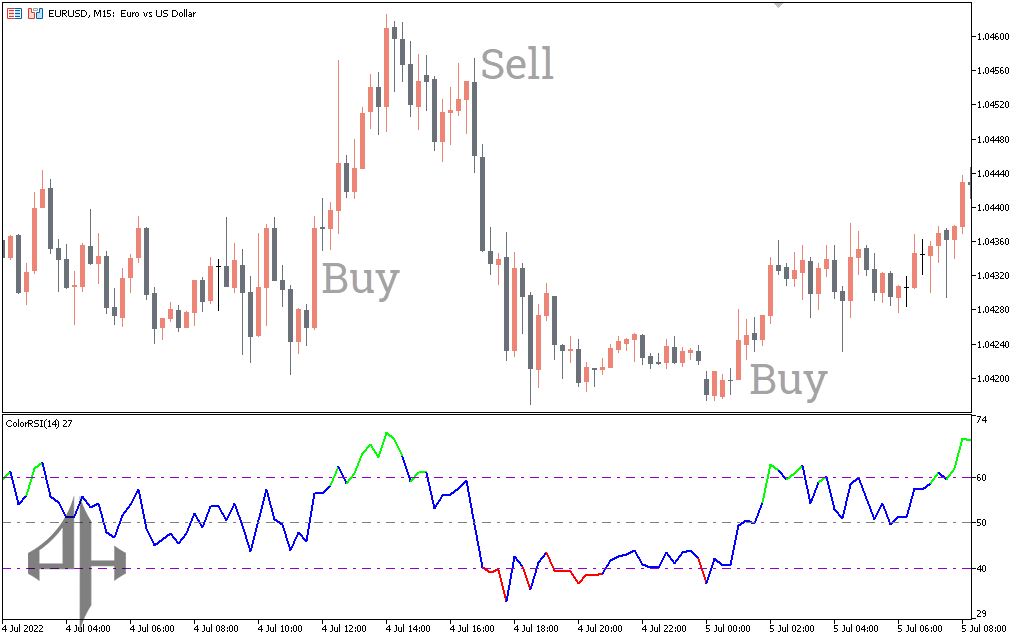
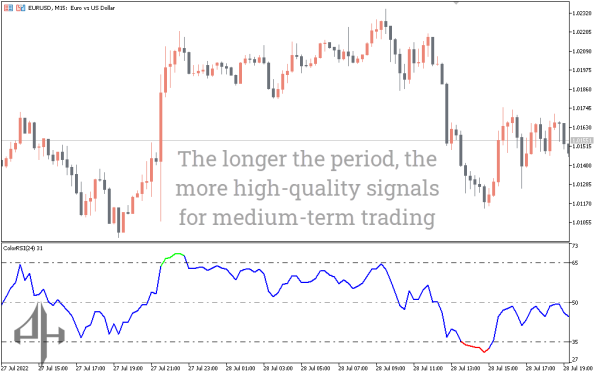
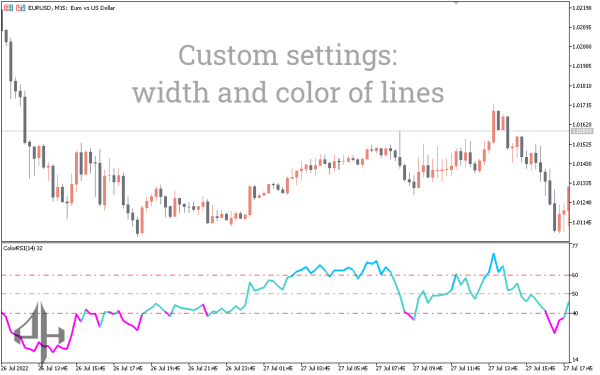
The Color RSI indicator for MT5 is displayed in action on the EURUSD M15 daily price chart above. The oversold and overbought areas are indicated in red and green, respectively, on the indicator displays in the RSI indicator oscillator window. The oscillator between the overbought and oversold areas is blue at the same time. When the indicator numbers drop below 40, the Color RSI indicator is considered oversold. A possible bullish reversal is indicated by the indicator’s color changing to red. With a stop loss below the previous swing low, forex traders can thus enter the market in a BUY position.
Profiting when the trade signal is the opposite or when the risk/reward ratio is superior to 1:2 is the greatest trading method. Similarly, the indicator becomes green and indicates a possible bearish market reversal if the RSI rises above 60 and becomes oversold. With a stop loss above the prior swing high, traders should therefore initiate a SELL trade.
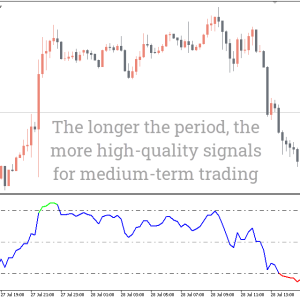
To help them follow the full trend, forex technical traders should maintain their positions until the opposite trading signal appears or until the oscillator’s values enter the overbought range. To find a profit-taking technique, forex traders could, nevertheless, use other technical strategies or candlestick patterns. This signal performs well in downward technical analysis since traders can use it on any chart. As a result, traders can use Color RSI Indicator to ascertain the trend’s direction over a longer time frame. At the same time, you can identify the optimal entry and exit positions by using charts with shorter time frames.
Conclusion
Technical Forex traders can overcome the traditional RSI indicator, the Relative Strength Index, which lacks cautions and arrow trading signals, by using the Color RSI Indicator for MT5.
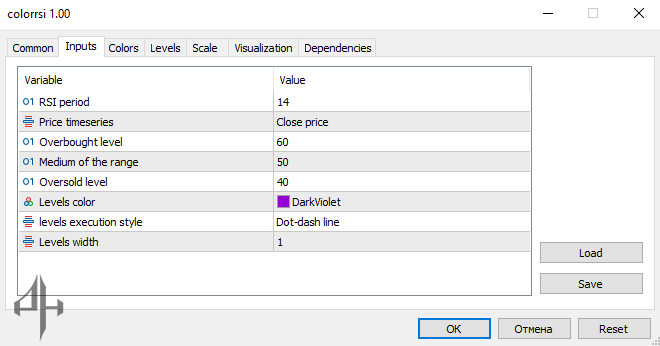
RSIPeriod: Sets the period for the indicator calculation.
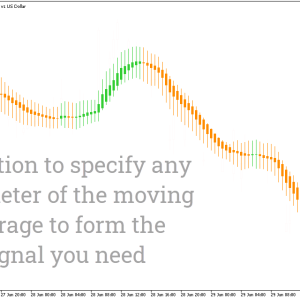
Price Timeseries: Specifies the candlestick price type used for the calculation.
OverBought Level: Defines the value considered as the overbought threshold.
OverSold Level: Defines the value considered as the oversold threshold.
Medium of the Range: Sets the midline level of the indicator range.
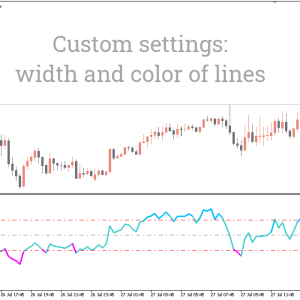
Levels Color: Changes the color of the level lines.
Levels Execution Style: Selects the style of the level lines.
Levels Width: Sets the thickness of the level lines.