

- Description
- Reviews (0)
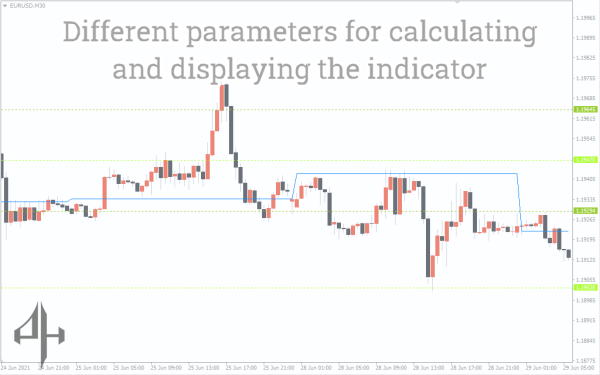
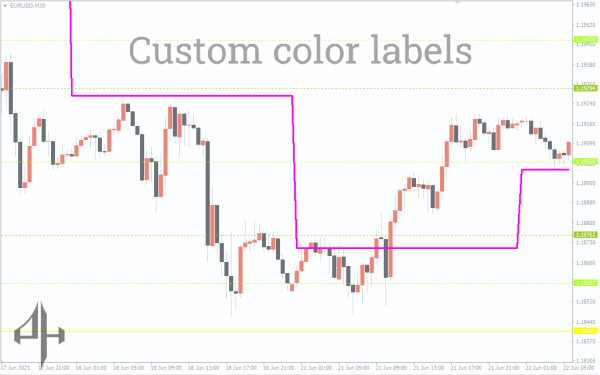
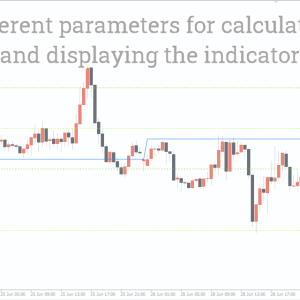
- Indicator Settings
Description
The fundamental levels in forex that all technical traders need to be aware of are support and resistance levels.
Even though these levels are crucial, placing them can be challenging for many technical traders, particularly novices.
The Daily Pivot Points Indicator is used to solve the problem of precisely placing important support and resistance levels.
The Foundation
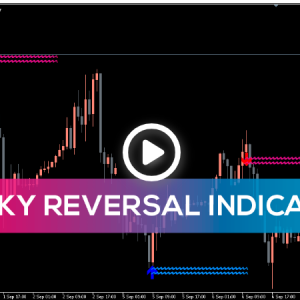
The MT4 Daily Pivot Points Indicator displays potential price reversal levels.
There are thirteen horizontal levels on the Daily Pivot Points Indicator chart. The chart below displays these levels.
The accompanying figure illustrates possible levels of support and resistance where price movement may occur.
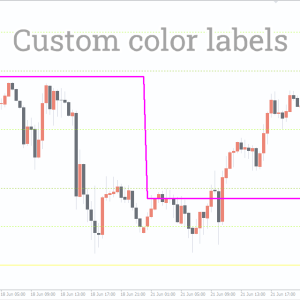
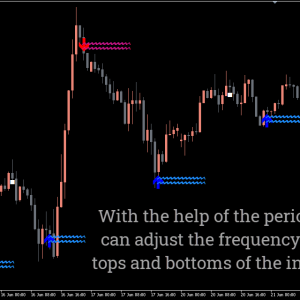
The graphic below shows the labels for the levels.
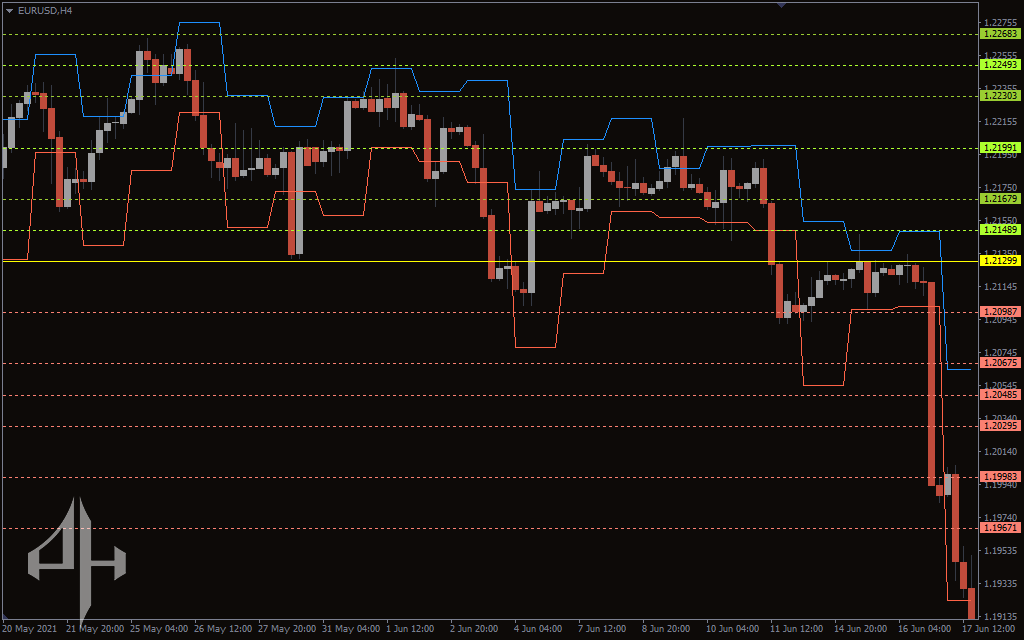
According to the above graphic, the first, second, and third resistance levels are denoted by the letters R1, R2, and R3, respectively.
The first, second, and third support levels are denoted by the S1, S2, and S3, correspondingly.
The pivot point line is the PP (yellow horizontal line), which is visible between the support and resistance zones.
Plotting midpoints or intermediate levels between the pivot point and support and resistance zones is another feature of the Daily Pivot Points Indicator.
The open, low, high, and close of the previous trading session are used to calculate the Daily Pivot Points Indicator.
The Pivot Point (PP) = (close + high + low)/3.
Other support and resistance levels are calculated from the Pivot Point.
First Resistance (R1) = (2 X PP) – Low.
Second Resistance (R2) = PP + (High – Low).
Third Resistance (R3) = High + 2 (PP – Low).
First Support (S1) = (2 X PP) – High.
Second Support (S2) = PP – (High – Low).
Third Support (S3) = Low – 2 (High – PP).
The ability of the Daily Pivot Points Indicator for MT4 to assist technical traders in identifying possible support and resistance zones is one of its benefits.
Additionally, this indication is objective because all traders calculate it using the same formula, in contrast to the majority of subjective technical indicators.
This indicator is particularly helpful for day traders, or short-term traders, to profit from slight price fluctuations.
This indicator is frequently used by market makers and forex specialists to spot possible reversal points.
How to use the Daily Pivot Points Indicator
Both breakout and range-bound traders can utilize the Daily Pivot Points Indicator for MT4.
This indicator can be used by range traders to locate reversal levels and execute buy or sell orders.
In essence, the S1, S2, and S3 are possible buy levels while the R1, R2, and R3 are possible sell levels, much like trading support and resistance levels.
Additionally, this can be used by breakout traders to determine crucial zones that must be broken prior to making trades.
When the R1, R2, and/or R3 signals are broken, the market is bullish and there is strong purchasing momentum.
After these levels are broken in this situation, a buy order may be issued.
Therefore, a break of the S1, S2, and/or S3 indicates that the market is extremely bearish and that selling pressure is severe.
After any of these levels are broken, a sell order may be placed.
The Daily Pivot Points can be utilized as a take-profit and stop-loss level in addition to being used to place buy and sell orders.
For optimal results, this indicator should be utilized in conjunction with candlestick patterns.
Conclusion
The MT4 daily Pivot Points Indicator aids traders in determining when to place trades and when reversal points may occur.
During trading, this indicator can also be utilized to determine take-profit and stop-loss levels.
RSI, MACD, and other indicators can be used in conjunction with this one.
Be the first to review “Daily Pivot Points Indicator, Master Key Market Levels”

The Daily Pivot Points Indicator in MT4 includes the following parameters:
-
Ext Formula: The extension formula used to calculate the pivot point.
-
Ext Many Days: The number of days considered for the extension calculation.
-
Ext Draw: Controls the drawing of the extension on the chart.

Reviews
There are no reviews yet.