
- Description
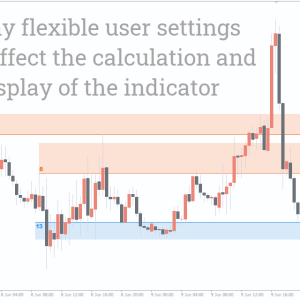
- Indicator Settings
Description
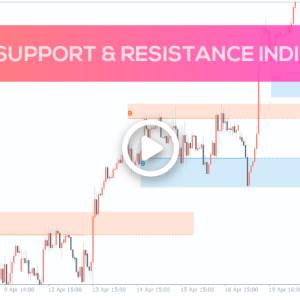
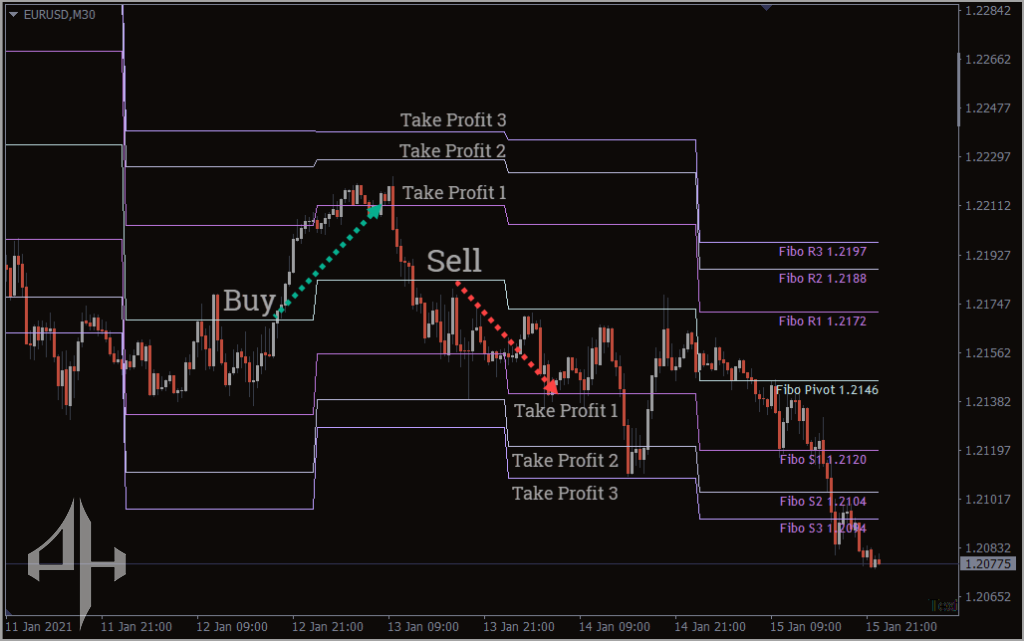
Finding the ideal support and resistance levels is crucial for both novice and seasoned traders. Pivot levels are frequently used by traders to comprehend current market trends. Traders can find strong support and resistance levels by combining Fibonacci ratios with pivot levels. The Fibonacci Pivots indicator offers several take-profit options in addition to a stop loss. Once the trend is established, it enables the trader to follow the markets.
The majority of traders begin the day by determining levels of support and resistance, which they subsequently confirm using additional indicators. The best support and resistance levels are automatically found by traders with the aid of the Fibonacci Pivots Indicator for MT4.
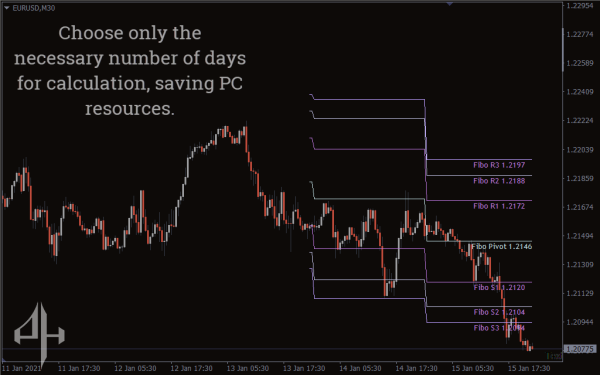
Another crucial step is determining the day’s possible trend. The high, low, and closing values from the previous day are used to calculate pivot points, which are then divided by three. The trend is considered negative if prices are below the pivot level from the previous day. If the current price remains above the Fibonacci Pivots Indicatorlevel, intraday traders often search for bullish price action.
Fibonacci Pivots Indicator numbers and their usefulness in forex trading are highly valued by both novice and seasoned traders. To determine the optimal levels of support and resistance, traders use the Fibo numbers to the pivot point. The Fibonacci ratios of 38.2, 61.8, and 76.4 are also used by market participants to determine three distinct barrier and support levels in trading.
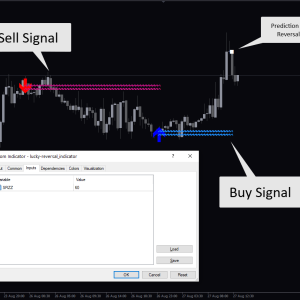
How can I trade Metatrader’s Fibonacci Pivots Indicator?
One initiates a BUY position if the price moves over the pivot level. The take-profit targets for profits 1, 2, and 3 are formed by the resistances R1, R2, and R3, accordingly. At these levels, traders would look to partial book profits. Below the S1 support, a stop loss is set.
The stops can be changed to break even if the price reaches R1. The stop can be moved to R1 if the price keeps rising and reaches R2, and subsequently to R2 and R3 as the price rises even higher.
The algorithm for determining the pivot point and the levels of support and resistance is provided below:
(Previous High+Previous Low+Previous Close)/3 is the pivot.
Pivot + (Previous High-Previous Low)*0.382 = Resistance 1
And:
Pivot-(Previous High-Previous Low)*0.382 = Support 1
Pivot + (Previous High-Previous Low)*0.618 = Resistance 2
And:
Pivot-(Previous High-Previous Low)*0.618 = Support 2
Pivot + (Previous High-Previous Low)*0.764 = Resistance 3
And:
Pivot-(Previous High-Previous Low)*0.764 = Support 3
Limitations Of Fibonacci Pivots Indicator
Since pivots are based on data from the previous day, market conditions may alter and the trend they represent may not always be followed. Support and resistance levels are mathematical values that are derived from Fibonacci numbers.
Conclusion
Although both indicators give weight to the resistance and support, successful trading necessitates further confirmation through price actions.
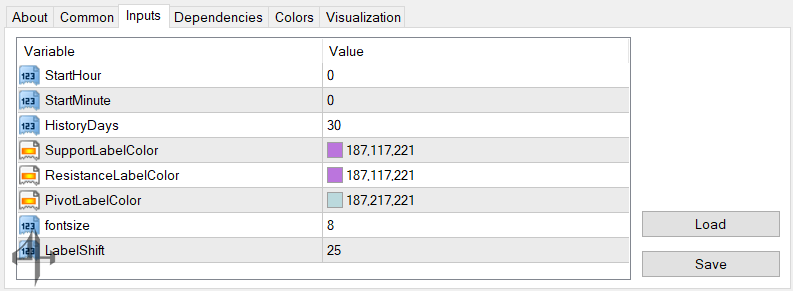
StartHour: The starting hour of the day used to calculate the pivot point.
StartMinute: The starting minute of the day for pivot point calculation.
HistoryDays: The number of past days for which the indicator will be drawn on the chart.
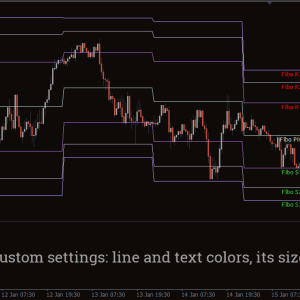
SupportLabelColor: The color of the text displaying the support price.
ResistanceLabelColor: The color of the text displaying the resistance price.
PivotLabelColor: The color of the text displaying the pivot price.
FontSize: Adjusts the font size of the displayed values.
LabelShift: Adjusts the position offset of the displayed values.