Fibonacci Retracement Indicator, Accurate Trade Predictions

Fibonacci Retracement Indicator automatically draws a grid. They will indicate prospective reversal points where the corrective movement may become a trend.

Updated: 

Description

You have probably already seen on multiple occasions that it is challenging to discern between trend waves and retracements because of the high volatility in the Forex market. A free Fibonacci Retracement indicator was created in order to address this issue. You can read this article to learn more.

Content:

1. 1. An explanation of the Retracement of the Fibonacci indicator (Fibo)
2. 2. Fibonacci level description
3. How to use the indicator

1. An explanation of the Retracement of the Fibonacci Retracement indicator (Fibo)

Fibonacci levels, also known as Fibonacci extensions, are automatically drawn on the MT5 chart by the indicator. In addition, it only considers the periods of active price movement and eliminates the “flat market” stage.

The potential depth of correction (rollback) in respect to the primary trend can be established with the use of Fibonacci extensions. You can determine the pivot points (or pivot points) from which the main trend is most likely to resume with the aid of levels.

Fibonacci Retracement Indicator


2. Fibonacci level description

Fibonacci extensions are computed as follows and shown as a percentage: Configure the Fibonacci grid to show percentage values of 23.6, 38.2, 50.0, and 61.8 (represented as values ranging from 0% to 100%). The six Fibonacci levels are constructed using the values that were obtained:

The starting position for Fibonacci level placement is 100%.
The so-called “golden ratio” is 61.8%. The 50% value is well-complemented by this level. It will therefore become more probable if the pullback wave around these two levels slows down. What is the support’s purpose?

50%—around this level, reversals frequently occur. This is due to the fact that short-term traders profit from their positions following trading reversals.
38.2%: When traders are extremely active and self-assured, reversals form around this level.
Reversals are infrequently generated around 23.6%. In order to identify entry positions, forex market participants frequently wait for a deeper drop.
0% is the final value at which Fibonacci levels are placed.

The level of 78.6% is seen when utilizing Fibonacci levels in other indicators. Rollback waves typically fall short of this threshold. This can be explained by the trend movement being reestablished earlier, that is, adjacent to higher levels. For this reason, the Fibonacci Retracement Indicator no longer uses the 78.6% extension level.

Every particular scenario on the chart should be considered in addition to the theoretical explanation of the levels. Therefore, there is a greater likelihood that the trend will resume if there was a strong trend prior to the rollback and the rollback wave is light.

On the other hand, pullbacks are likely to become a new, opposing trend if they are more powerful than the main trend.
Additionally, the likelihood of reestablishing the primary trend will be increased if the Fibonacci Retracement Indicator levels align with the levels of round numbers (check out the free RoundLevels indicator) or other technical analysis tools.

3. How to use the Fibonacci Retracement Indicator

In addition to other indicators, we advise using the Fibonacci Retracement Indicator into your trading strategy. The likelihood of a successful trading outcome increases with the number of indications that tell you to open a trade.

We’ll employ the trend line, one of the most important technical analysis tools, as an extra trading indication. We must download the AutoTrendLines indicator for free in order to accomplish this.

The retracement wave has ceased climbing in the vicinity of the 50.0% and 61.8% Fibonacci levels, as can be seen in the preceding chart. This could be the first indication of a sea change and the beginning of sales.

As a supplementary signal in this case, the trend line shows that there is a low chance of the decline resuming close to it.

Finding the turning points when the negative trend resumes is worthwhile. It would be safer to position the stop loss behind the trend line.

Similar to selling, a trend line—an extra indicator that denotes a positive trend—is visible on this chart.

The retracement move only made it to the 38.2% Fibonacci Retracement Indicator level, in contrast to the sell. This implies that traders in the foreign exchange market are upbeat and actively engage in purchases.
You can place the stop loss behind the support line and start a trade at the market price in this situation.

The indicator levels are not redrawn when switching between timeframes. Double-clicking the indicator and removing it will fix this flaw. The indicator will then operate in automated mode for the duration of your choosing.

The primary benefit of indicator levels is their practicality. The indicator will be helpful for spotting strong reversals following pullbacks, regardless of the trading time frame and strategy you are employing (long-term, intraday, or scalping).

Using Fibonacci Retracement Indicator levels, you can also see how players in the Forex market are feeling overall. Being aware of this increases your ability to forecast future price movements.

Reviews

There are no reviews yet.


Be the first to review “Fibonacci Retracement Indicator, Accurate Trade Predictions”

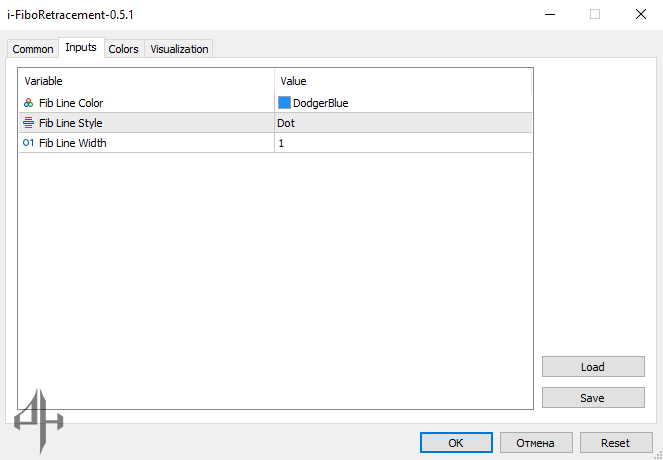
In the indicator settings, the following parameters can be adjusted:

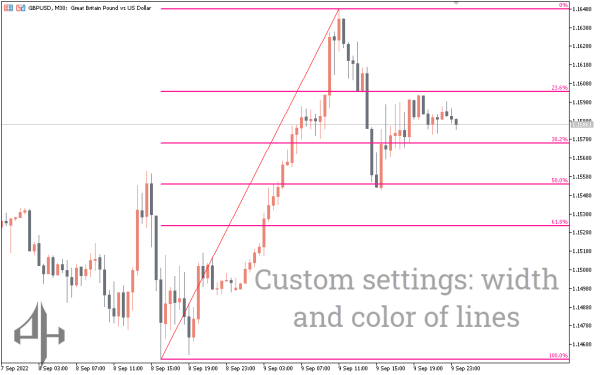
  • Fib Line Color – lets you choose the color of the Fibonacci levels.

  • Fib Line Style – allows you to select the line type for displaying the Fibonacci levels.

  • Fib Line Width – enables you to adjust the thickness of the Fibonacci lines.

Related Products