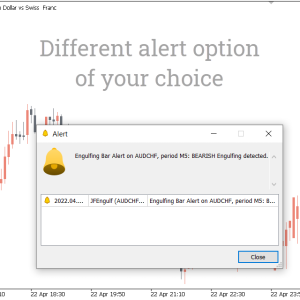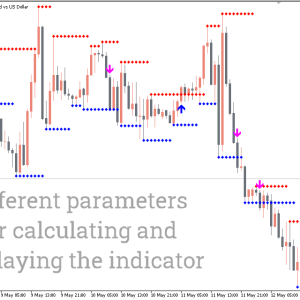
- Description
- Indicator Settings
Description
When watching a trend over a long time and getting out of the market when trends are fading, the Heiken Ashi indicator is quite beneficial. The Japanese Candlestick is the most popular and favoured chart for technical analysis of the three charting methods utilised in the Forex market. Each bar’s open, high, low, and close are displayed on the candlestick, which also tells whether the candle is bullish or bearish.
Despite being the most popular chart, the high level of market noise makes it vulnerable to several false signals. The Heiken Ashi indicator is used to fix issues that occur while utilising Japanese candlesticks.
Foundation
A Japanese candlestick known as the Heiken Ashi indication is smoother than a standard candlestick since it employs an average of two periods.
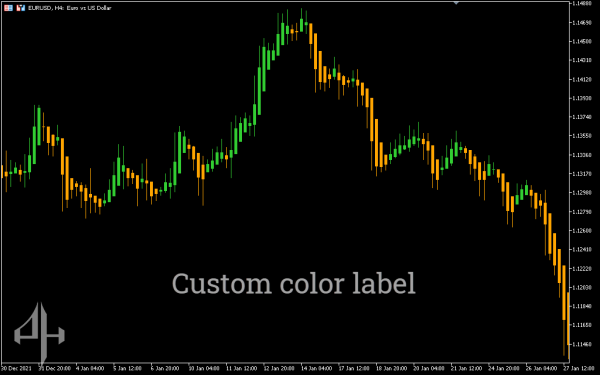
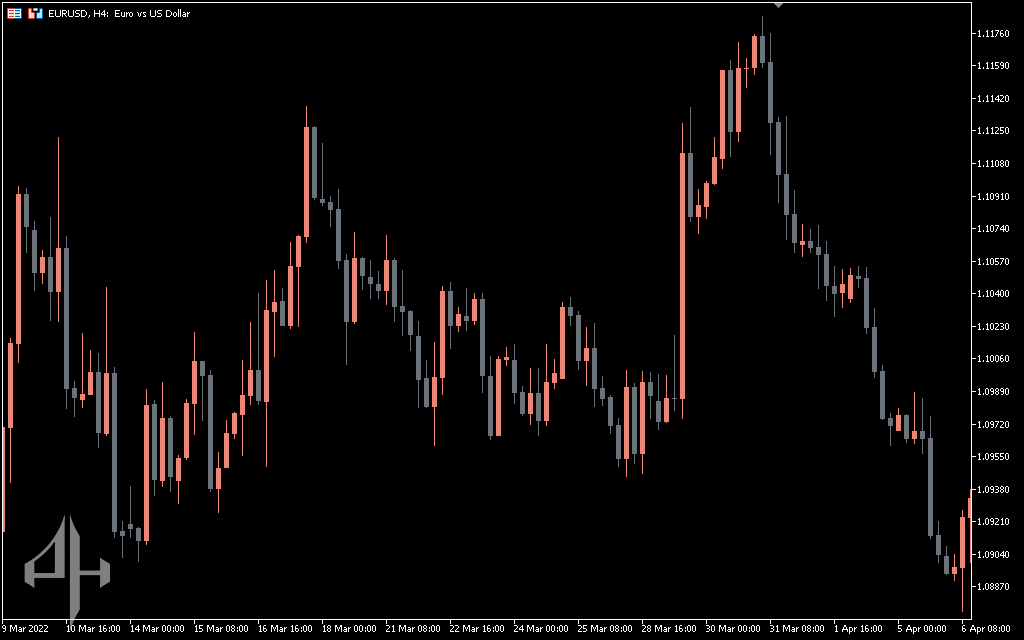
The EUR/USD H4 of two distinct charts is displayed in the figures below:
- the Heiken Ashi Indicator
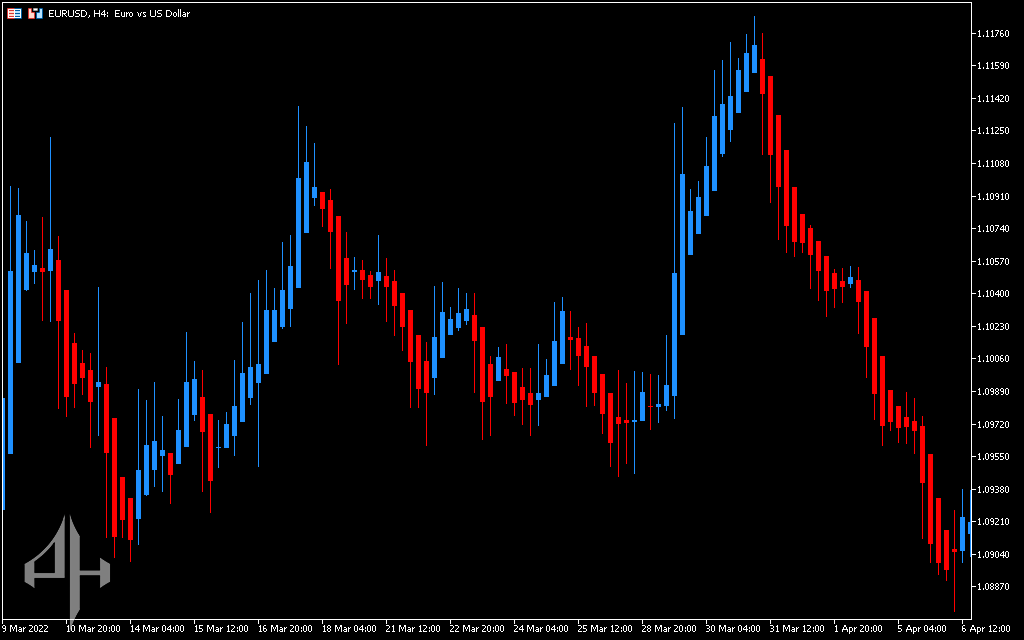
- the ordinary Japanese candlestick
Regular Japanese candlesticks frequently shift from red to blue in the two charts above, which can make them challenging to read.
On the Heiken Ashi chart, on the other hand, candles are more consistently coloured, remaining blue during an uptrend and red during a fall.
Finding trends and trend reversals is made simpler by the indicator’s assistance in smoothing out charts and removing market noise.
This indicator helps traders decide whether to exit or hold by detecting trends and trend reversals.
The Heiken Ashi indicator is particularly useful for tracking trends for extended periods of time and for exiting the market when those trends start to wane.
How to use the Heiken Ashi indicator
Technical traders use the Heiken Ashi indicator to spot trends.
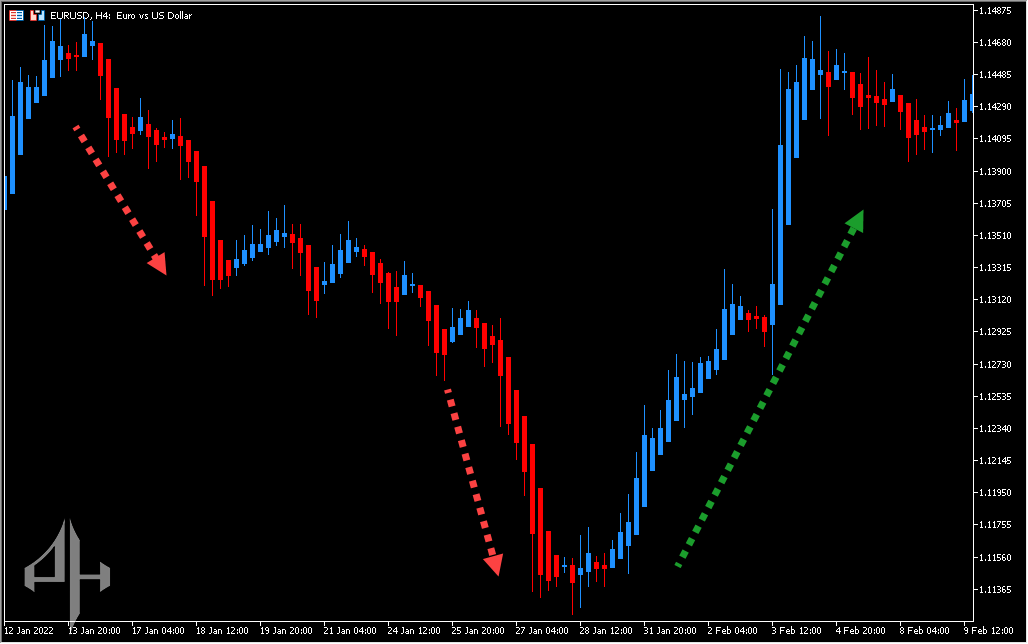
The Heiken Ashi indicator’s red candles indicate a downward trend. However, as the chart below illustrates, blue candles indicate that the trend is upward.
The indicator’s candle wick can also be used to gauge how strong the trend is.
In an uptrend, bullish candles with no lower wick indicate that the trend is strong.
Additionally, a significant downturn is indicated by bearish candles without a top wick.
For a downtrend, open short trades and close long trades when the Heiken Ashi candle turns red from blue.
The indicator candle turning blue from red indicates an uptrend, so close short trades and start long ones.
Like traditional Japanese candlesticks, Heiken Ashi indicator candles can stop reversal signals like dojis and spinning tops.
Conclusion
The Heiken Ashi indicator works best for long-term use and trend spotting. The indicator is therefore most appropriate for trend traders.
In a slow or volatile market, this indicator reduces misleading trading signals, helping traders stay out.
Scalpers and intraday traders shouldn’t use these signal candles because they react more slowly.
For long-term trend tracking, the indicator works best for swing and position trading.
>>>rc=”https://piphunter.io/wp-content/uploads/2025/05/Untitled-253-1.png” alt=”” width=”711″ height=”377″ />
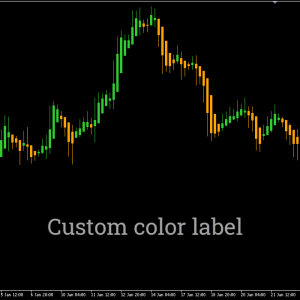
lass=”” data-start=”70″ data-end=”158″>The indicator’s color can only be modified in the ‘Color’ tab within the settings.</p>