Hull Moving Average Indicator, Breakthrough Hull Moving Average

The Hull Moving Average Indicator is an MT4 technical indicator. Provides superior trend-following forex day trader buy–sell tips. Supports MTF charts.

Updated: 

Description

A short-term trend indication indicator designed specifically for the MetaTrader 4 platform is the Hull Moving Average Indicator (HMA). The most well-known features of this indicator are its rapid trend-reversal warnings and emphasis on recent price data.

Exponential Moving Averages (EMA) are typically preferred by traders who are looking for trend signs based on recent changes in price-action. because when used for short-term trend analysis, Simple Moving Averages (SMA) lag more than EMAs. In this sense, the Hull Moving Average provides forex day traders with trend trading signals that are both quick and fluid.

How to determine forex day trading signals using the Hull Moving Average

The HMA functions similarly to other moving averages when used to predict the state of the trend. This indicator may respond more quickly to recent price changes and produce more indications because it was specifically designed for short-term trend spotting. Therefore, to improve outcomes, you can combine its trend indications with candlestick patterns to raise the likelihood of success.

Hull Moving Average Indicator

The EURUSD chart above indicates that the market was initially erratic and that the price was not trending either bullishly or bearishly. The price repeatedly broke the HMA level throughout this time. However, because of the price’s incredibly short range change, none of those signals were successful.

The price sketched three consecutive bullish candles after crossing above the Hull Moving Average Indicator line. The indication level was being rejected by each of those candles, which were treating it as support. Since the price trend crossed above the indication line, it became bullish. Those bullish-tailed bars were also suggesting that the present bullish price trend would continue. As we can see, once the price was rejected at the Hull Moving Average Indicatorsupport line, it produced a significant rising rise.

The price must close below the indicator curve, indicating a bearish market trend, in order to be considered a sell confirmation. To ensure that the price is adhering to the moving average line as resistance, next, search for a bearish candlestick pattern.

Conclusion

The best thing about the Hull Moving Average Indicator is that it reacts to changes in price activity much more quickly than other conventional moving averages. Regular moving averages’ long-term lagging problems have been resolved by this indicator’s unique feature. Additionally, this indicator enhances its smoothing results while moving quite closely to the candle price. The Hull Moving Average indicator, on the other hand, just tells you about the present trend situation and concentrates on recent market movements. In contrast to a SMA or EMA crossover, it does not provide future trend signals.


Reviews

There are no reviews yet.


Be the first to review “Hull Moving Average Indicator, Breakthrough Hull Moving Average”

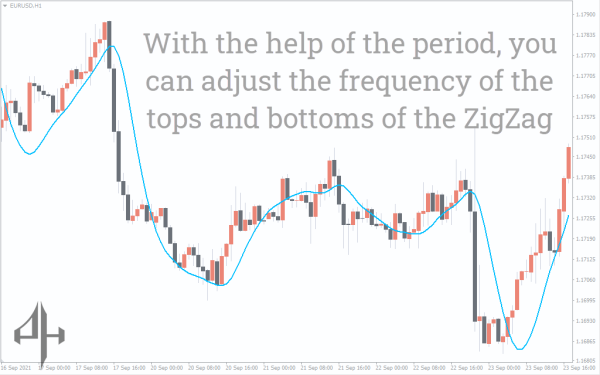
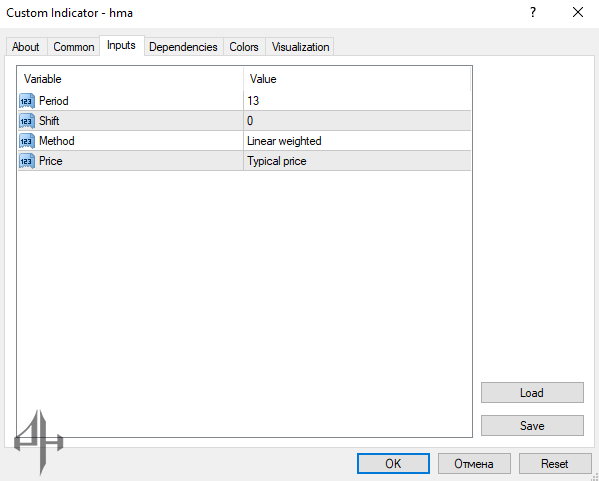
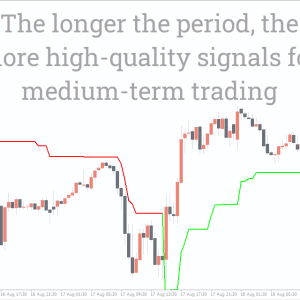
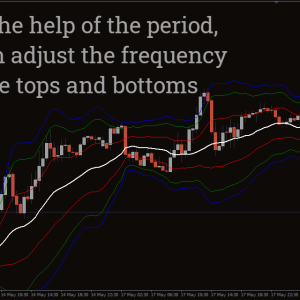
Period: Defines the number of candles the indicator uses to convert price data into a moving average.

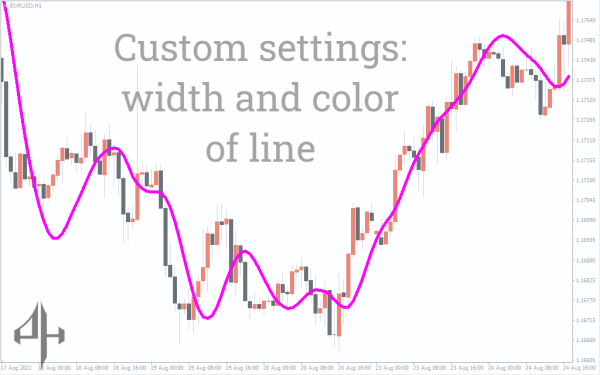
Shift: Adjusts the indicator’s position relative to the price level by specifying the distance or offset.

Method: Selects the calculation technique for the moving average, such as simple, exponential, smoothed, or linear weighted.

Price: Specifies the type of price data the indicator will use to calculate the average. Options include open, close, high, low, median, weighted, or typical price.

Related Products