
- Description
- Reviews (0)
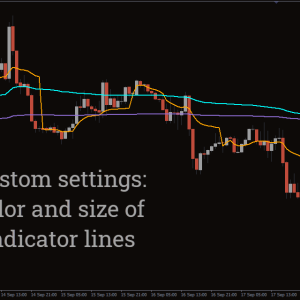
- Indicator Settings
Description
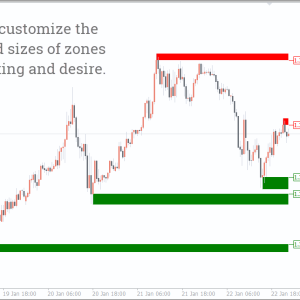
Every effective forex trader has the ability to recognize regions of supply and demand. The trader’s profitability rises when these locations are correctly identified. These zones are optimally depicted on an MT4 chart by the I Supply Demand Zones Indicator.
I Supply Demand Zones Indicator
Support and resistance lines are comparable to SUPM zones. The resistance and support lines and zones are not the same, though. These zones offer greater support and resistance as well as a larger region of supply and demand.
Additionally, a single support or resistance line cannot be used by forex traders to BUY or SELL. However, depending on their trading approach, most traders join within a zone.
How to trade forex using the I Supply Demand Zones Indicator?
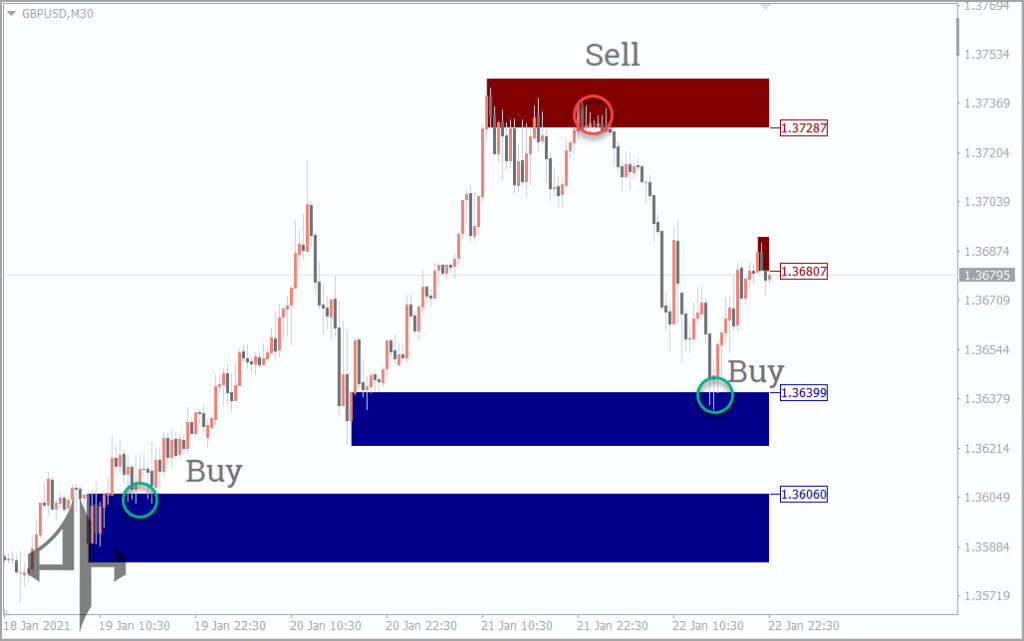
The best zones are automatically identified by the indicator and displayed on the MT4 chart. The indicator helps the trader identify them right away and removes uncertainty.
Traders purchase in anticipation of a price increase from a demand region. Conversely, sell a supply region in anticipation of a bearish price move.
The majority of traders position their stop loss above the sup-zone and below the dem-zone. While some traders follow a sensible risk-reward ratio, swing traders typically hold positions until the price hits the opposite zone.
How can I Supply Demand Zones Indicator with longer time frames be used for profitable trading?

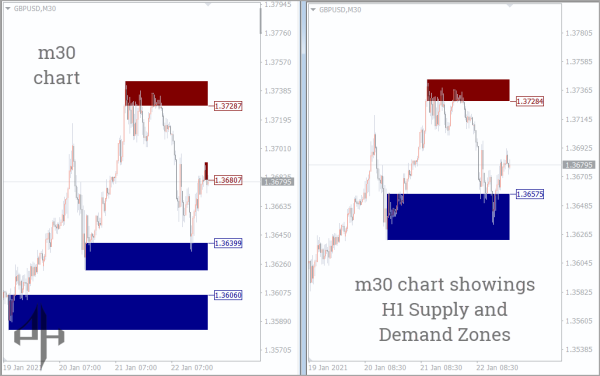
Identifying I Supply Demand Zones Indicator on higher timeframes is crucial for aligning with the overall market trend, as these zones tend to be more reliable than those on lower timeframes.
In the example above, the image on the left displays GBPUSD on the M15 chart with marked supply and demand areas, while the image on the right shows the same pair with zones identified on the H1 chart.
This dual-timeframe view enables traders to visually recognize and interpret key areas across both charts. With this understanding, forex traders can make more informed decisions and improve trade execution.
I Supply Demand Zones Indicator is valuable not only for beginners but also for experienced traders employing more advanced strategies.
Limitations
On an MT4 chart, this indicator automatically draws the zones. But the trader has to carefully verify them. The market may eventually break supdem zones if they fail. For more confirmation, traders must rely on price activity.
Conclusion
Without a doubt, supdema forex trading is a tried-and-true method. Additionally, this top supply and demand zones indicator automatically gives the trader the information they need about the regions.
Be the first to review “I Supply Demand Zones Indicator, Revolutionary Supply Demand Zones”
The parameters of the indicator are as follows: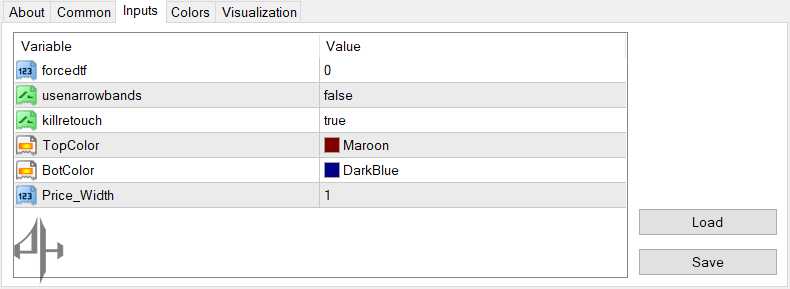
forcedtf: Set to 0 by default, which uses the current chart’s timeframe. Inputting another timeframe value will display support and resistance levels from that specified timeframe on the current chart.
usenarrowbands: When enabled, this option reduces the thickness of the support and resistance zones for a more precise display.
killretouch: If the price revisits an existing support or resistance level, enabling this setting will trigger a redraw of those levels.
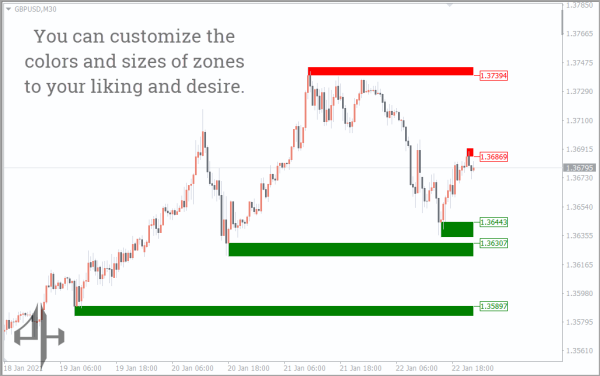
TopColor: Defines the color used for resistance zones.
BotColor: Defines the color used for support zones.
Price_Width: Adjusts the font size of the price labels shown at support and resistance levels.
Reviews
There are no reviews yet.