- Description
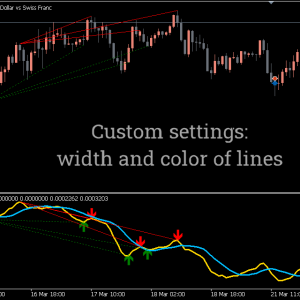
- Indicator Settings
Description
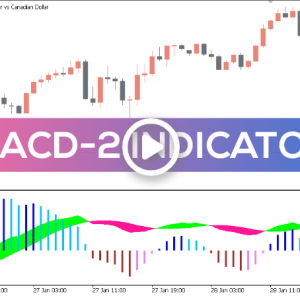
The most effective and successful way to spot early bullish and bearish trend reversals is through divergence trading. However, the secret to this profitable forex trading strategy is spotting a divergence. When a divergence occurs, the MT5 MACD Divergence Indicator scans the chart and notifies the forex trader. Additionally, the indicator offers BUY and SELL signals that are based on arrows.
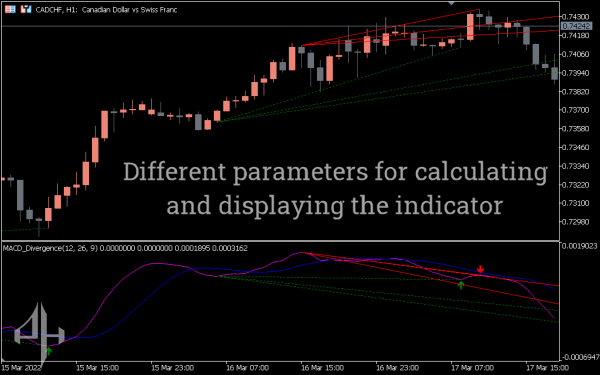
The normal divergence and the reverse divergence are the two types of divergences plotted by the Metatrader 5 MACD Divergence indicator, which uses the MACD lines in relation to the histogram. Solid lines are used to represent the regular divergence, and dotted lines are used to plot the reverse divergence.
In a typical bullish divergence, the indicator produces a higher low while the price creates a new lower low. Conversely, in a reverse bullish divergence, the indicator produces a lower low while the price sets a new higher low. When there is a bearish divergence, the opposite is true.
By giving the user regular and reverse divergence and convergences, the indicator serves as a flexible tool that gives stock and forex traders a variety of trading chances.
The MT5 Trade Signals MACD Divergence Indicator
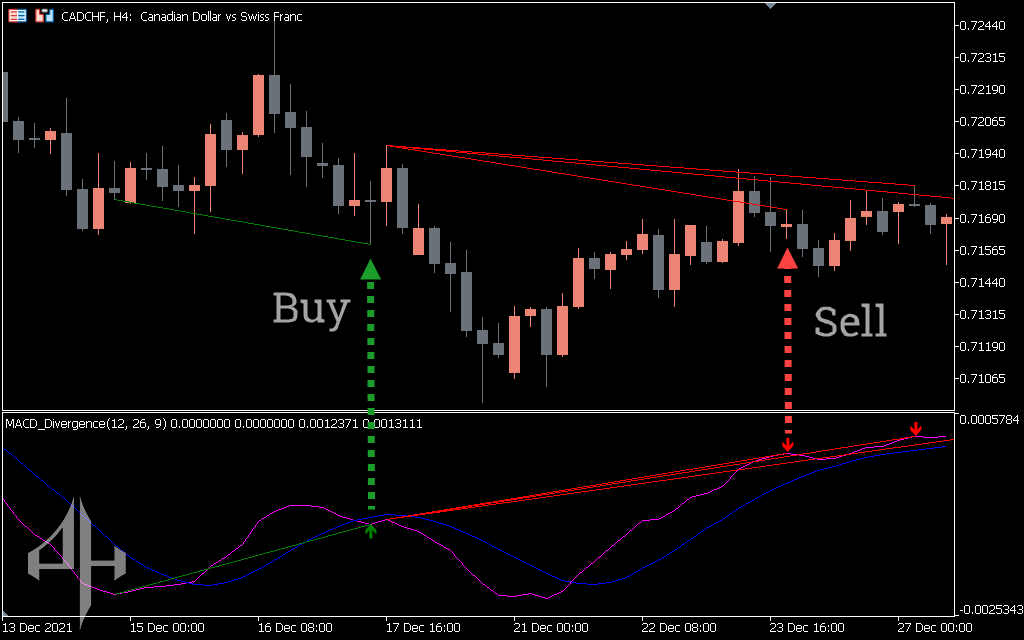
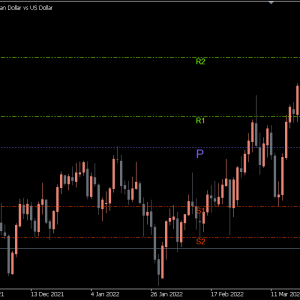
The trend lines plotted at the bullish and bearish divergences, as well as the BUY and SELLS arrow indications, are displayed in the CADCHF H4 chart above.
To prevent the trading signals from being repainted, the signals are delayed by one candle. Because the indicator offers the best-filtered signals, the delay is unavoidable and acceptable for technical traders. Nonetheless, skilled technical traders can verify the signals by examining the conventional MACD Divergence Indicator.
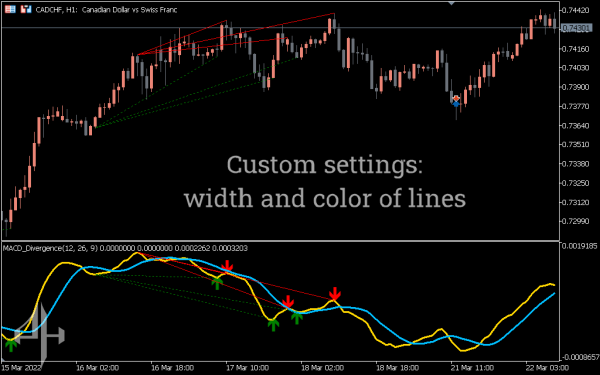
The price chart and indicator’s bullish divergence are shown in green, while the indicator’s MACD lines are drawn in magenta and blue. On the other hand, the indicator displays a red bearish divergence.
The indicator uses colored lines to graphically represent divergence and convergence. The indicator’s free download is yet another excellent feature. Additionally, when the signs occur, the indicator sends out alerts. For novice stock and forex traders who find it difficult and perplexing to identify and validate convergence and divergence, these aspects make it useful. However, for experienced forex and stock traders, the indicator scouts the divergences and presents them immediately for further action.
The MACD Divergence Indicator Metatrader 5 is applicable to all charts and timeframes for forex traders. However, trading with larger time frame charts is advised for better outcomes.
Conclusion
the greatest indicator for stock and forex traders looking to trade bullish and bearish divergences is Metatrader’s Divergence Indicator. It turns become a crucial technical instrument. It automatically scans and alerts the forex and stock traders with both regular and reverse divergence. Lastly, the indicator is available for free download for traders.
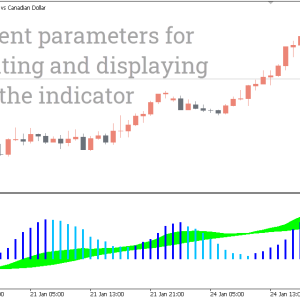
There are settings for the MACD indicator and additional parameters to show the trendlines in the MACD Divergence indicator.
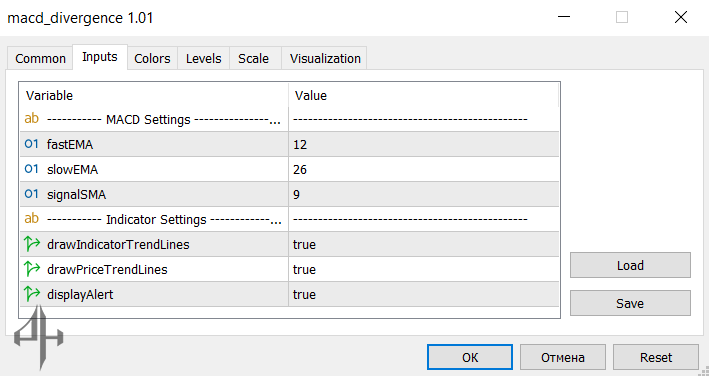
fastEma: The period for the fast Exponential Moving Average (EMA) used in the Moving Average Convergence Divergence (MACD) calculation.
slowEma: The period for the slow EMA used in the MACD calculation.
signalSMA: The period for the Simple Moving Average (SMA) of the MACD signal line.
drawIndicatorTrendlines: Enables drawing trendlines on the MACD indicator.
drawPriceTrendlines: Enables drawing trendlines on the price chart.
displayAlert: Enables or disables alert notifications.