
- Description
- Reviews (0)
- Indicator Settings
Description
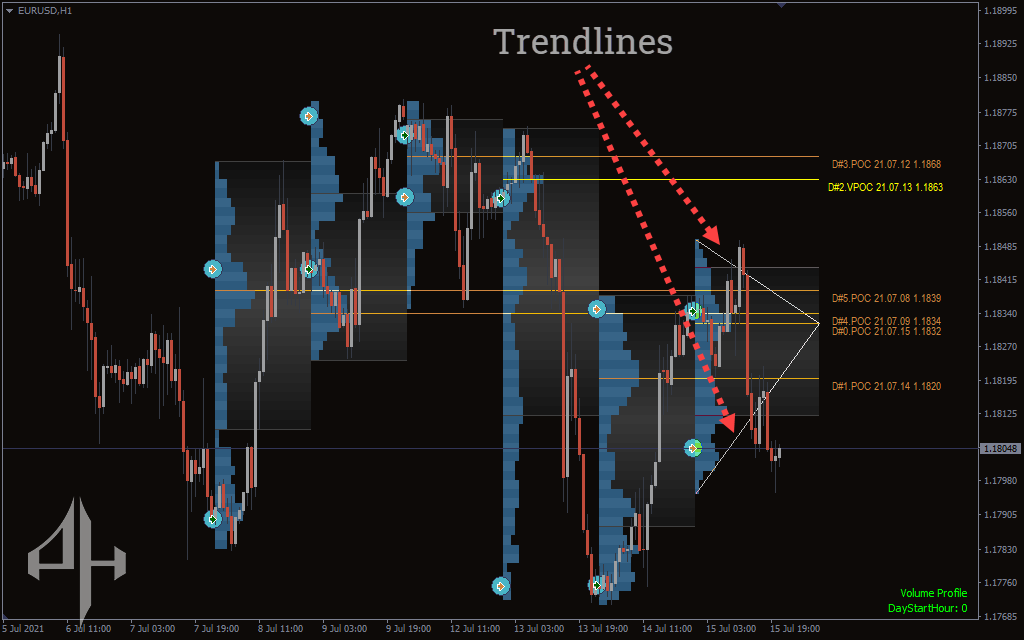
The most significant price levels, value region, and control value for a given trading session are highlighted by the Market Profile Trendlines indicator, which shows price density across time.
Data from the volume, timing, and number of ticks at particular levels during a predetermined period are combined to create the indicator.
This tutorial will go into greater detail about the MP Trendlines indicator and how to apply it to your trading strategy.
What is a Market Profile Trendlines indicator?
A trader on the Chicago Board of Trade (CBOT) created the Market Profile indicator. Its initial goal was to present time and price data gathered during a trading session in an intelligible manner.
Because it incorporates the trend lines, the MP Trendlines indicator differs from the conventional one. Additionally, this indicator examines the areas of a currency pair or other market where the highest price activity is taking place at any given moment.
The most precise tick data—each and every market tick or change—is used in its calculations. The histogram is produced by the Market Profile Trendlines indicator using this information.
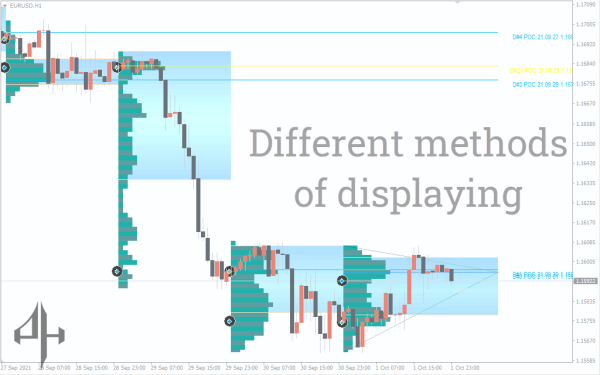
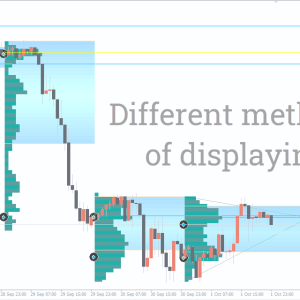
At specific price levels and zones, the histogram only shows the areas with the highest trading activity and price motion. The Market Profile Trendlines indicator creates a histogram from right to left. It can be useful to focus on the present trading session without making its chart too complicated, as opposed to the usual left-to-right arrangement.
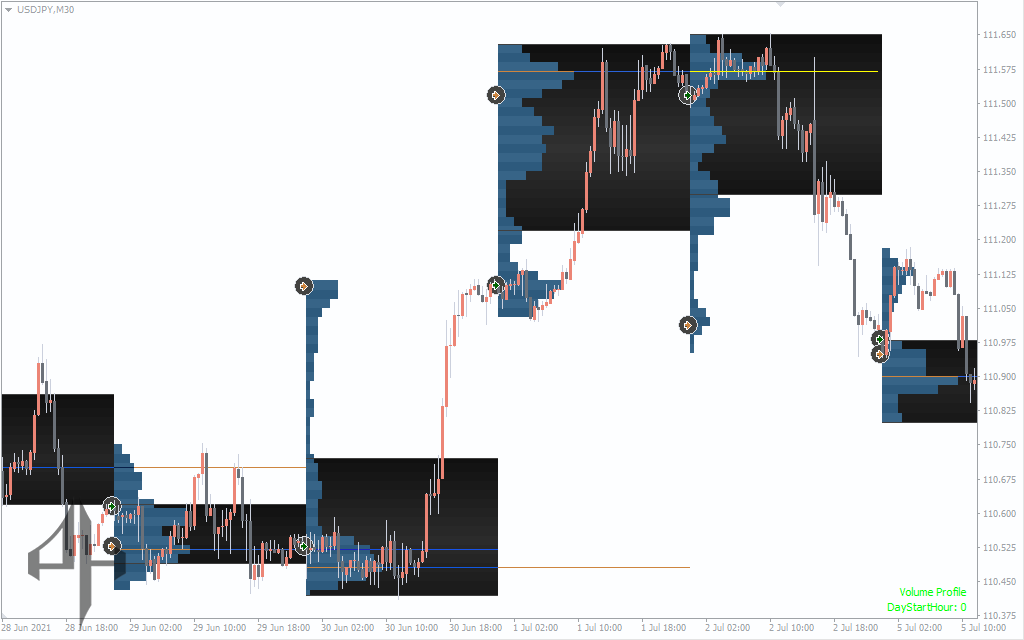
You will always be aware of the most important price levels and price zones for upcoming price changes in any market when you use this indicator.
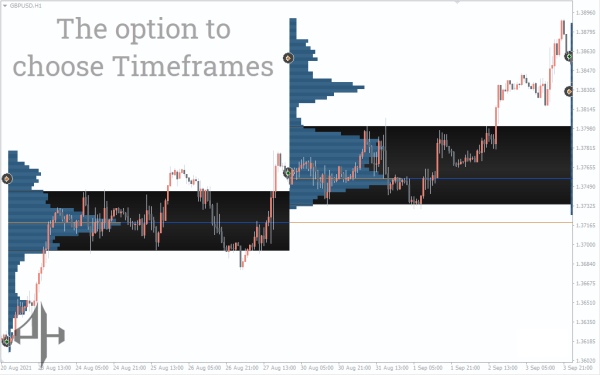
The Market Profile Trendlines indicator shows the profiles for trading sessions and can be used on periods from M1 to D1. This indicator does not use standard MetaTrader indicators; it is purely based on price action.
How to use the Market Profile Trendlines indicator
The Market Profile Trendlines indicator is primarily used in the value area.
As the market moves through a session, buy and sell orders will cause the price to move up and down. This indicator creates a value area by combining tick, volume, and time data.
The middle ground between the present levels of supply and demand is represented by this price range. You will be represented by the top and bottom market profiles in addition to the value area.
Trading technique using Market Profile Trendlines indicators
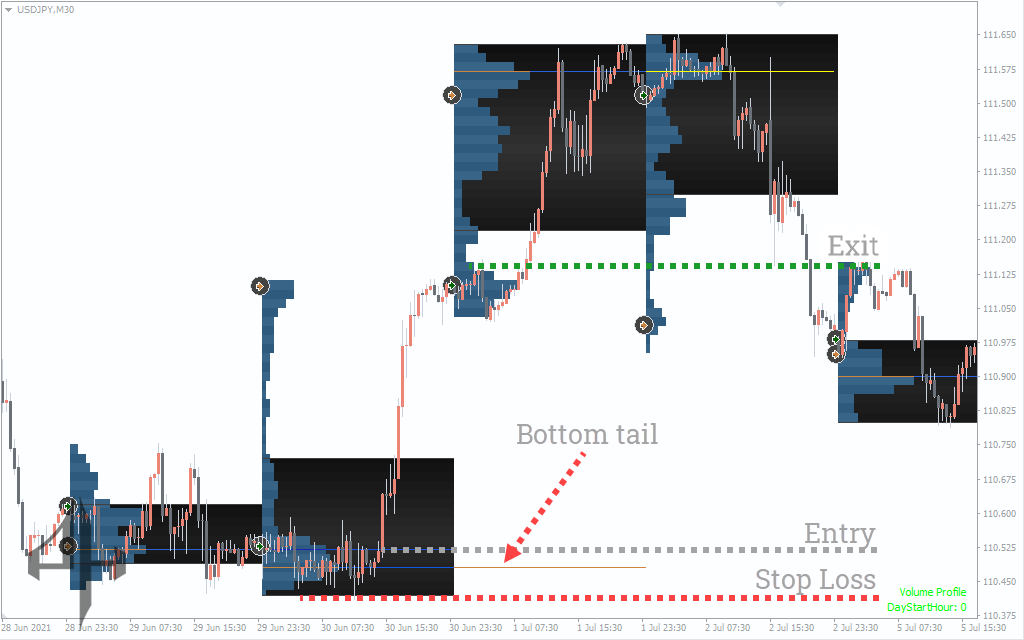
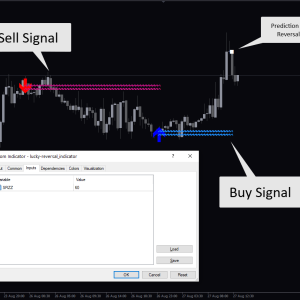
Price zones rejected by the market are identified by prominent tails extending above and below the value area. The lower tail indicates buyers overpowering sellers at those price levels, whereas the upper tail signifies sellers dominating buyers in those regions.
Buy Setup:
-
Identify the bottom tail on the chart.
-
Wait for the price action to shift to a bullish trend.
-
Set a stop-loss near the most recent low.
-
Exit the position when the trend reverses.
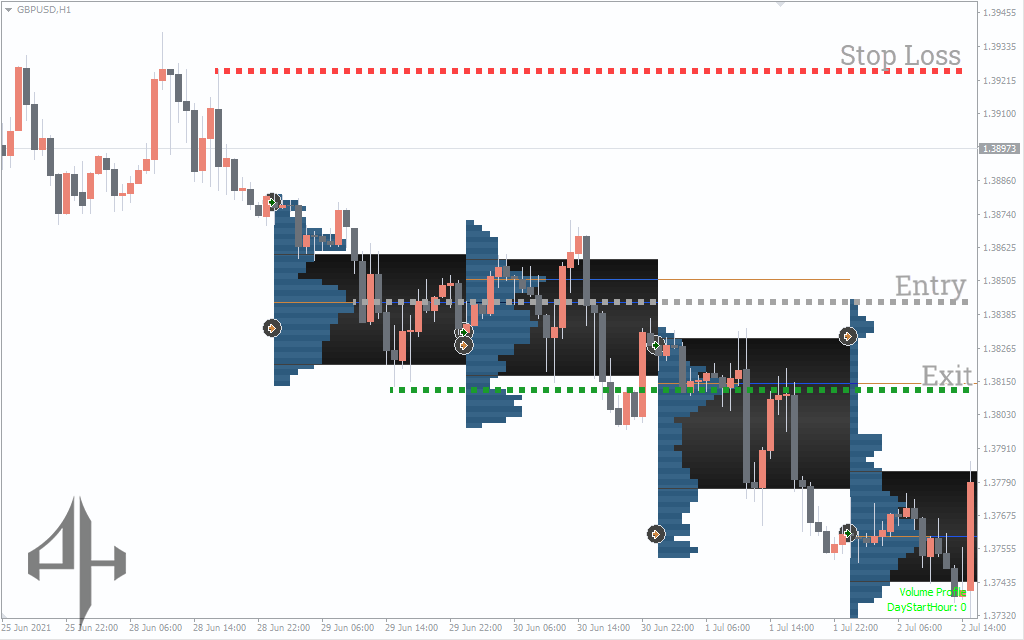
Sell Setup:
-
Identify the top tail on the chart.
-
Wait for the price action to shift to a bearish trend.
-
Place a stop-loss near the most recent high.
-
Exit the trade when the trend reverses.
Conclusion
An excellent tool for identifying each and every price movement in a current period is the Market Profile Trendlines indicator. To verify the direction of the price action, it is preferable to combine the indicator with additional technical analysis, such as Simple Moving Averages.
Be the first to review “Market Profile Trendlines Indicator, Dominate Market Movements with Confidence”
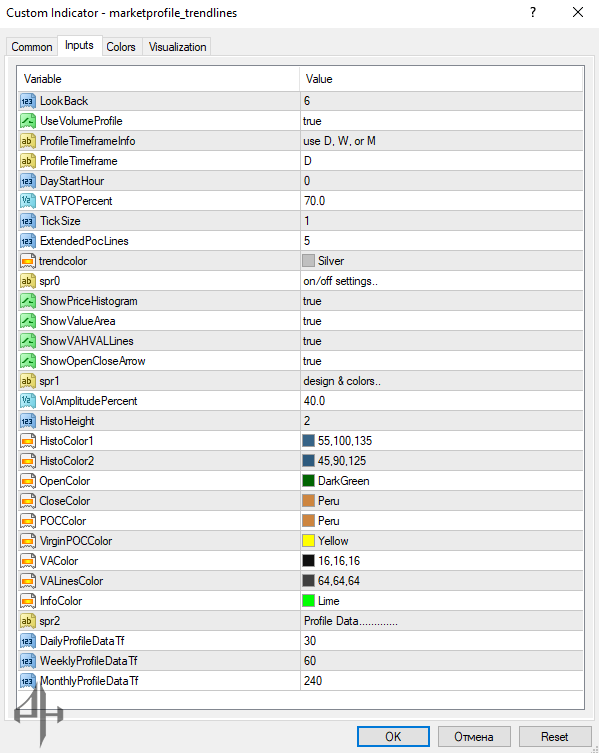
LookBack: Displays a specified number of selected profiles.
UseVolumeProfile: When enabled (true), displays the current volume profile.
ProfileTimeframeInfo: Draws profiles based on the selected timeframe.
ProfileTimeframe: Indicates the current timeframe used.
DayStartHour: Specifies the starting hour for the profiles.
VATPO Percent: Shows the percentage gain of profiles within the selected timeframe.
TickSize: Represents the size of each tick.

Reviews
There are no reviews yet.