- Description
- Indicator Settings
Description
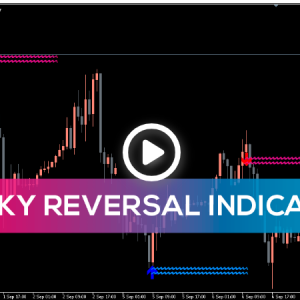
One of the primary instruments for identifying trend reversals (retracements or the beginning of new trends) is the MTF Fractal Indicator. Even with a single order, they let you enter at the best time and earn a lot of points.
Furthermore, the fractal indicator’s signals are exceptionally accurate because it never requires redrawing. In reality, traders employ both modified algorithms and the instrument’s basic version. The topic of discussion in this essay will be them.
What is the operation of the MTF Fractal indicator?
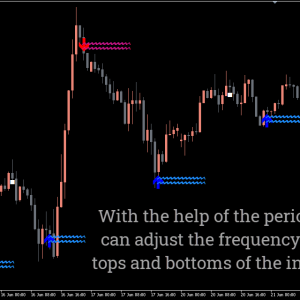
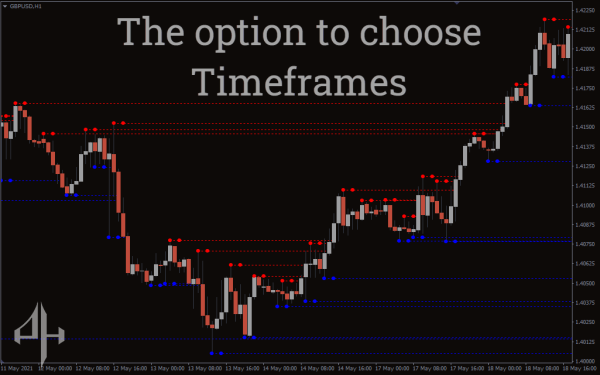
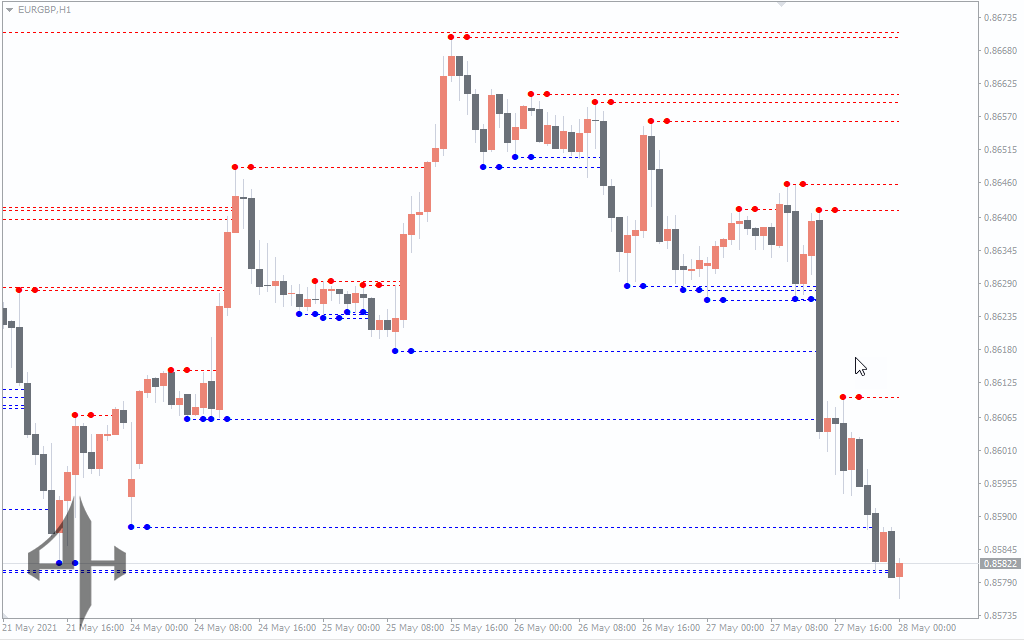
The traders can view the fractals of all time frames on a single chart by using the MTF Fractal indicator.
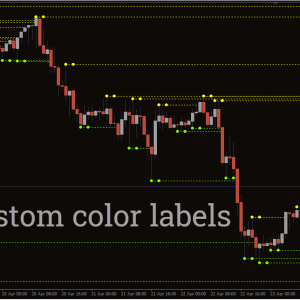
By default, red highlights up fractals and blue highlights down fractals. The indicator shows details about the price level and the timeframe on which the fractal forms when the mouse pointer is placed on the line.
For traders who incorporate aspects of fractal theory into their trading, the MTF Fractal indicator is useful. By enabling you to view all the information on a single screen without having to open extra tabs, the indicator makes your job easier.
An indicator can also be used as a component in the development of a trading system or in the enhancement of an already-existing one.
Trading strategy using MTF Fractal indicators
Let’s now talk about the trading technique using the MTF Fractal indicator.
Buy setup
-
When an up fractal (blue line) appears, wait for a bullish candle to close above the fractal support.
-
Place a buy stop order a few pips above the high of that candle.
-
Set a stop-loss slightly below the fractal support.
-
Take profit and close the position manually when down fractals appear, or set take profit at the next horizontal resistance level.
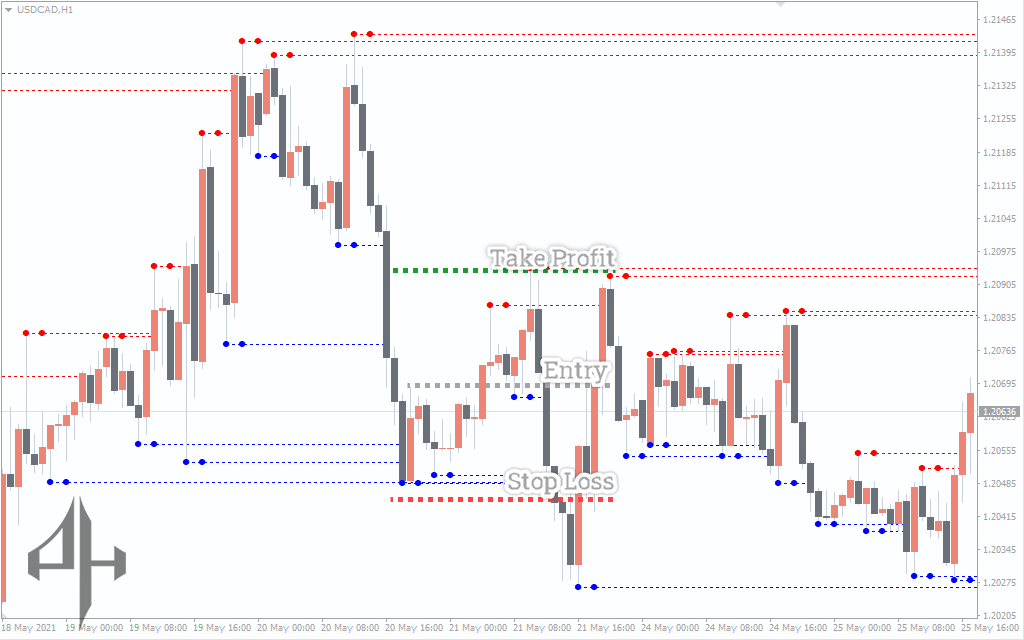
Sell setup
-
When a down fractal (red line) appears, wait for a bearish candle to close below the fractal resistance.
-
Place a sell stop order slightly below the low of that candle.
-
Set a stop-loss slightly above the fractal resistance.
-
Take profit and close the position manually when up fractals appear, or set take profit at the next horizontal support level.
conclusion
A popular trend indicator for identifying trend reversals or retracements is the MTF Fractal. Any timeline can be used with the indicator. But relying just on the indicator is not a good idea. To reduce the danger and validate your trade entry, you might use additional tools.
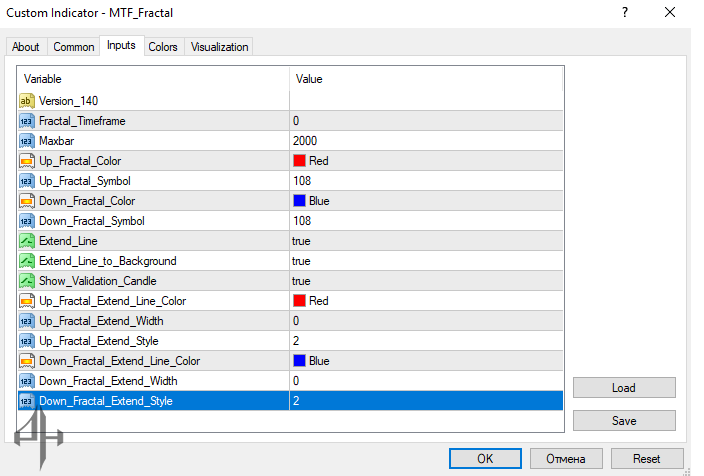
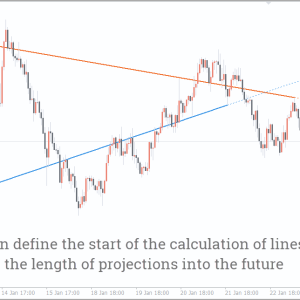
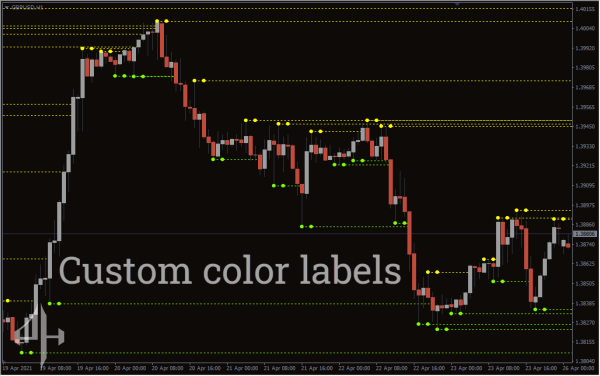
You can customize the color and style of the MTF Fractal indicator lines along with other technical settings.
-
Maxbar: Sets the maximum number of bars or candles to which fractals are applied.
-
Fractal_Timeframe: Default is 0, meaning fractals are placed based on the current timeframe. You can specify a different timeframe if desired.
-
Up_Fractal_Symbol: Default value is 108, indicating the up fractal lines extend for 108 bars or candles.
-
Down_Fractal_Symbol: Default value is 108, indicating the down fractal lines extend for 108 bars or candles.