

MTF High Low Indicator, Unlock Multi-Timeframe Insights
MTF High Low Indicator for MT4 shows daily, weekly, and monthly highs and lows with pivot for forex trading. Free to Download.
- Description
- Reviews (0)
- Indicator Settings
Description
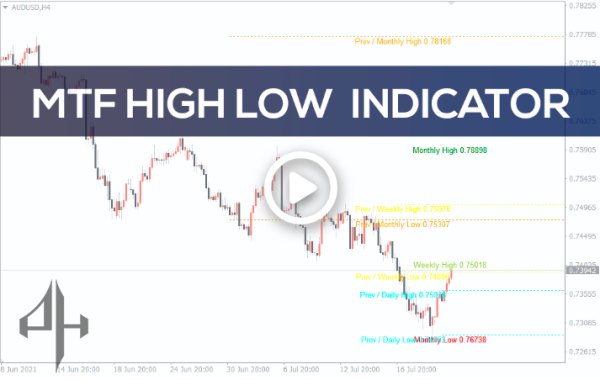
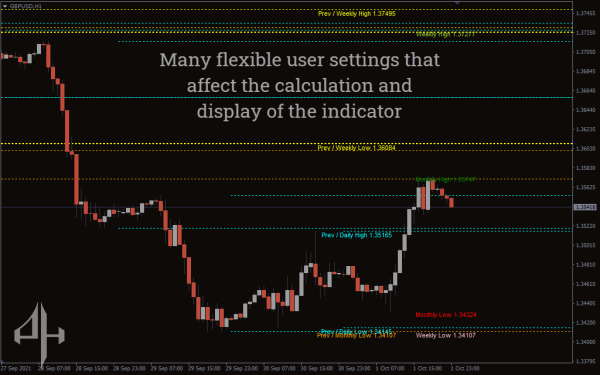
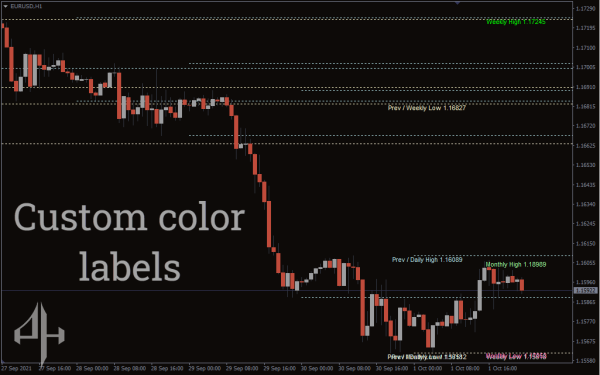
Plotting the historical and present daily, weekly, and monthly high and low levels on the chart is what the MTF High Low Indicator for MT4 does. It also plots the chart’s daily, weekly, and monthly pivot lines.
Additionally, the indicator shows a rectangle for the daily, weekly, and monthly chart sections. Because of this, forex traders can quickly determine which trends are bullish or bearish over a variety of time frames and apply them to any technical trading approach. Thus, the indicator can help the trader determine the optimal times to buy and sell.
The indicator is most effective for novice and experienced traders. Forex traders can download and install the indicator for free, and it is compatible with all periods.
For MT4 Trading Setup, MTF High Low Indicator
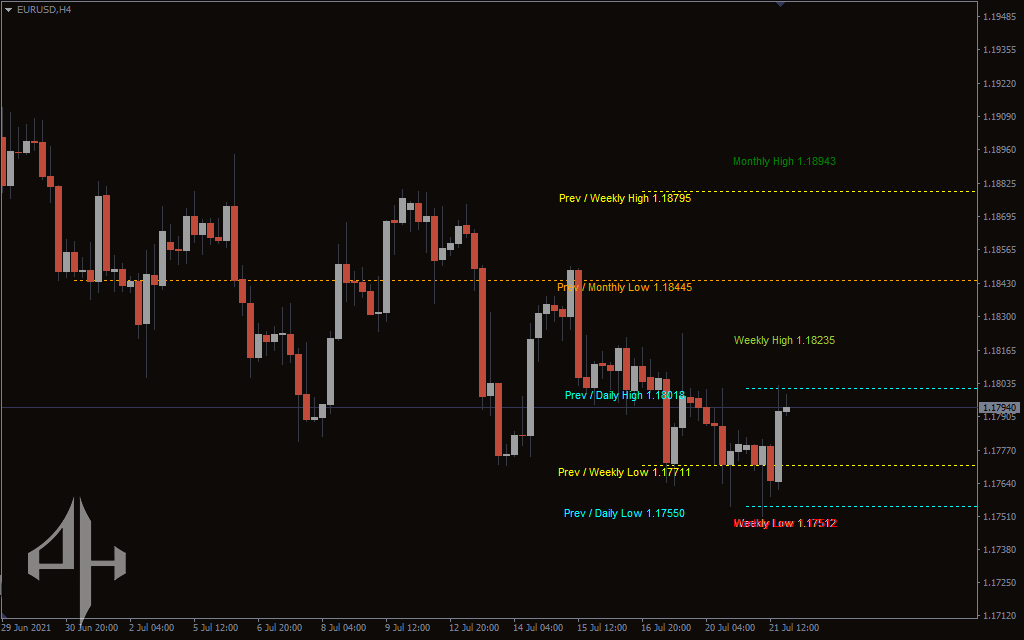
The MTF high low indicator for MT4 is active in the EURUSD H4 chart above. Along with the pivot lines, the indicator displays all required high and low values. Thus, pivot traders can determine whether to BUY or SELL on a chart with a lower time frame by analyzing the trend in the higher timeframes. Additionally, the ideal time to buy or sell is usually during the highs and lows of the longer timeframes. Finding all the information in a snapshot and using it appropriately in a technical trading approach is evident.
Conclusion
It goes without saying that the MTF high low indicator for MT4 gives the forex trader a picture of several timeframes. They therefore successfully support the trader in both bullish and bearish patterns. The indicator is very simple to install and available for free download.
Be the first to review “MTF High Low Indicator, Unlock Multi-Timeframe Insights” Cancel reply
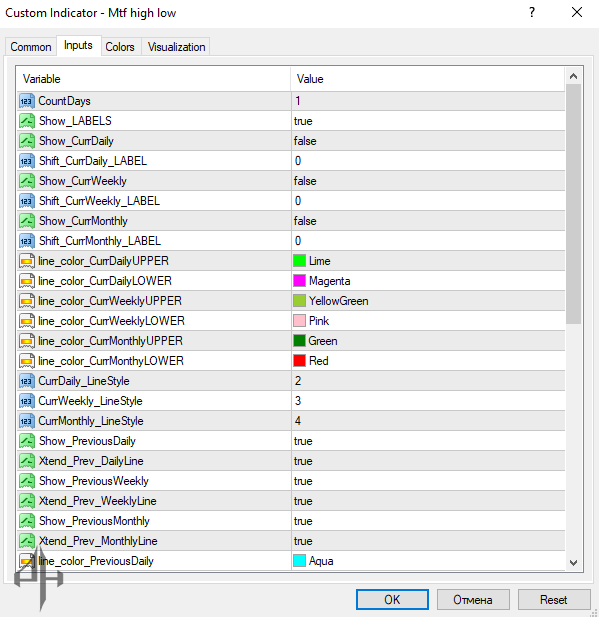
General Settings
-
CountDays: Sets the number of days to look back for historical data.
-
Show_LABELS: Enables or disables the display of text labels.
Current Period High/Low Levels
-
Show_CurrDaily: Displays the current day’s high and low levels.
-
Shift_CurrDaily_LABEL: Adjusts the horizontal placement of the daily label.
-
line_color_CurrDailyUPPER: Sets the color for the current day’s high line.
-
line_color_CurrDailyLOWER: Sets the color for the current day’s low line.
-
CurrDaily_LineStyle: Defines the line style for current daily levels.
-
Show_CurrWeekly: Displays the current week’s high and low levels.
-
Shift_CurrWeekly_LABEL: Moves the weekly label further from the price.
-
line_color_CurrWeeklyUPPER: Color for the current week’s high line.
-
line_color_CurrWeeklyLOWER: Color for the current week’s low line.
-
CurrWeekly_LineStyle: Line style for current weekly levels.
-
Show_CurrMonthly: Displays the current month’s high and low levels.
-
Shift_CurrMonthly_LABEL: Adjusts the position of the monthly label.
-
line_color_CurrMonthlyUPPER: Color of the current month’s high.
-
line_color_CurrMonthlyLOWER: Color of the current month’s low.
-
CurrMonthly_LineStyle: Line style for current monthly levels.
Previous Period High/Low Levels
-
Show_PreviousDaily: Displays the previous day’s high and low levels.
-
Xtend_Prev_DailyLine: Extends the previous day’s levels across the chart.
-
line_color_PreviousDaily: Color of the previous daily lines.
-
Show_PreviousWeekly: Displays the previous week’s high and low.
-
Xtend_Prev_WeeklyLine: Extends the previous weekly levels.
-
line_color_PreviousWeekly: Color for previous weekly levels.
-
Show_PreviousMonthly: Displays the previous month’s high and low.
-
Xtend_Prev_MonthlyLine: Extends the previous month’s levels.
-
line_color_PreviousMonthly: Color of the previous month’s lines.
-
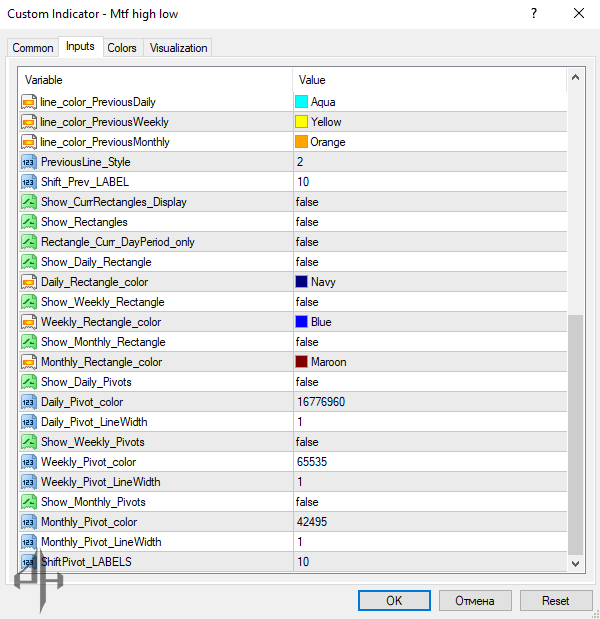
PreviousLine_Style: Sets the line style for all previous period levels.
-
Shift_Prev_LABEL: Adjusts the label position for previous levels.
Rectangles Display (Chart Zones)
-
Show_CurrRectangles_Display: Toggles display of the current area using a rectangle.
-
Show_Rectangles: Enables or disables rectangle visualization for all periods.
-
Rectangle_Curr_DayPeriod_only: Displays a rectangle for the current day only.
-
Show_Daily_Rectangle: Shows daily zones as rectangles.
-
Daily_Rectangle_color: Sets the color of the daily rectangle.
-
Show_Weekly_Rectangle: Displays weekly chart zones using rectangles.
-
Weekly_Rectangle_color: Color of the weekly rectangle.
-
Show_Monthly_Rectangle: Enables display of monthly rectangles.
-
Monthly_Rectangle_color: Color of the monthly rectangle.
Pivot Point Display
-
Show_Daily_Pivots: Draws daily pivot levels on the chart.
-
Daily_Pivot_color: Color of the daily pivot lines.
-
Daily_Pivot_LineWidth: Width of the daily pivot lines.
-
Show_Weekly_Pivots: Displays weekly pivot lines.
-
Weekly_Pivot_color: Color of the weekly pivot lines.
-
Weekly_Pivot_LineWidth: Line thickness for weekly pivot lines.
-
Show_Monthly_Pivots: Displays monthly pivot levels.
-
Monthly_Pivot_color: Color for the monthly pivot lines.
-
Monthly_Pivot_LineWidth: Line width of the monthly pivot.
-
ShiftPivot_LABELS: Adjusts the horizontal position of pivot point labels.


Reviews
There are no reviews yet.