
- Description
- Reviews (0)
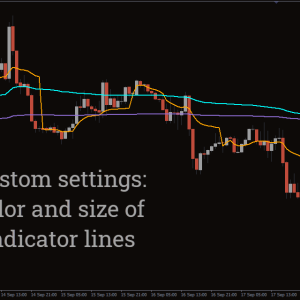
- Indicator Settings
Description
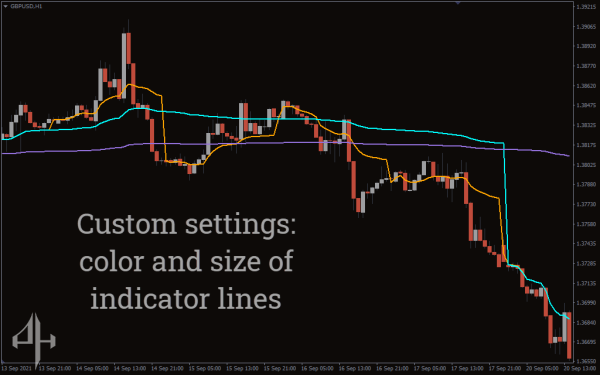
The New VWAP indicator uses weighted volume to display the average price of a currency pair. The volume-weighted average price is known as the VWAP.
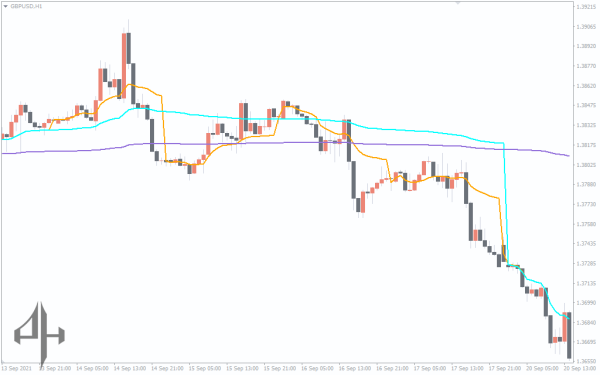
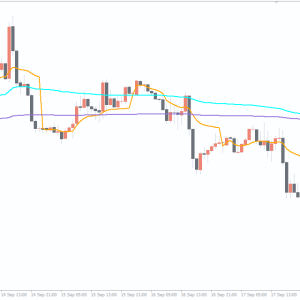
Three lines, one for each of the daily, weekly, and monthly periods, make up the indicator. These lines identify the total volume of the market and divide it according to its weight.
The New VWAP indicator resembles Bollinger Bands or Moving Averages. Moving averages and VWAPs differ in that VWAP places greater emphasis on weighted volume.
It determines the weighted volume’s average price. You can determine entrance and exit locations by using this weighted volume detection to determine levels of support and resistance.
When the weekly and monthly lines cross, the indicator sends out signals, creating both long-term and short-term chances. To avoid false signals, it is better to utilize the indicator on an hourly chart, even if it performs well on all timeframes.
How to trade with the New VWAP indicator?
The weighted volume through average price is the focal point of the New VWAP indicator. This computation aids in determining the resistance and support levels. You can use these levels to determine whether to enter or exit a transaction.
When the weekly and monthly lines cross over, the indicator generates signals. For example, the monthly line is green, whereas the weekly line is red.
A bullish indication is given when the weekly line crosses above the monthly line. However, when the weekly line falls below the monthly line, it is a bearish indicator.
You can use the daily yellow line for both bullish and bearish trends because it functions as a neutral line. The trend’s direction is followed by this line. The yellow line climbs higher whenever there is an uptrend. On the other hand, it moves lower during a downtrend.
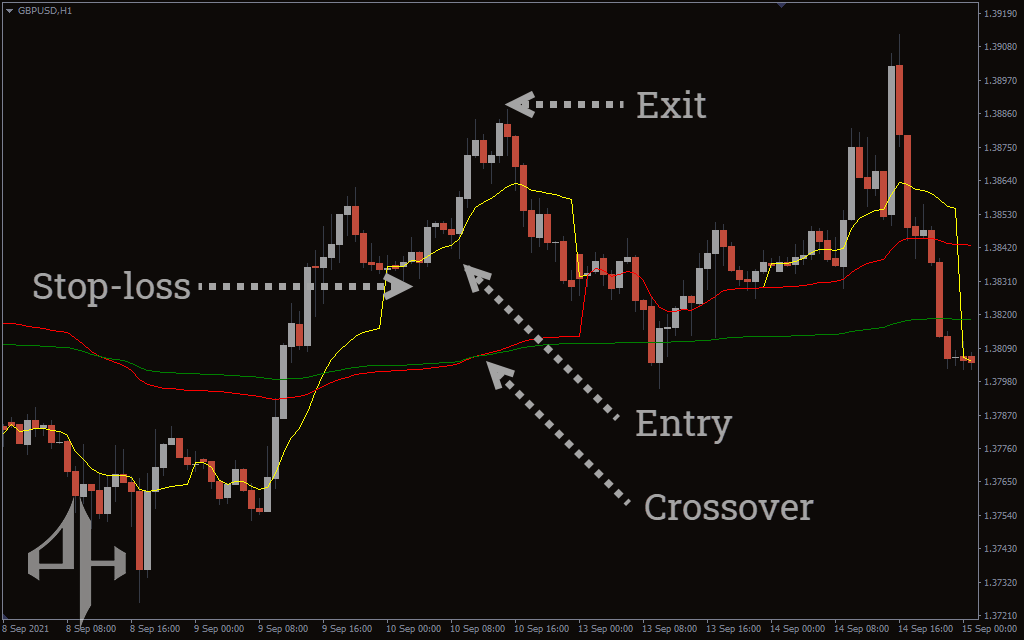
New VWAP indicator buy setup
- Above the green line, the red line must cross.
- Hold off until the price has finished moving.
- At the crossing or after it, enter the trade.
- Place a stop-loss close to a buying point’s low.
- When the trend shifts, get out of the transaction.
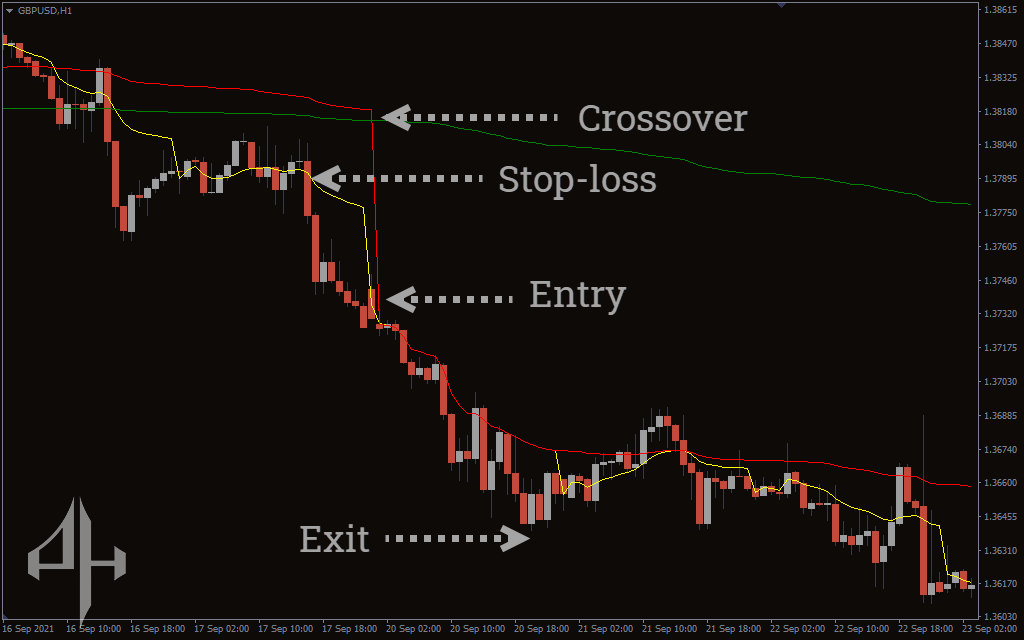
New VWAP indicator sell setup
-
Ensure the red line crosses below the green line.
-
Wait for the price to confirm the downward movement.
-
Enter the trade at the point of crossover or shortly after.
-
Place a stop-loss just above the recent high near the sell signal.
-
Exit the trade when there’s a clear indication of a trend reversal.
Conclusion
By concentrating on the weighted volume, the New VWAP indicator for MT4 gives you precise entry and exit locations. You can combine the indicator with other technical analysis tools, such as the RSI or stochastics, to further validate the indications.
Be the first to review “New VWAP Indicator”
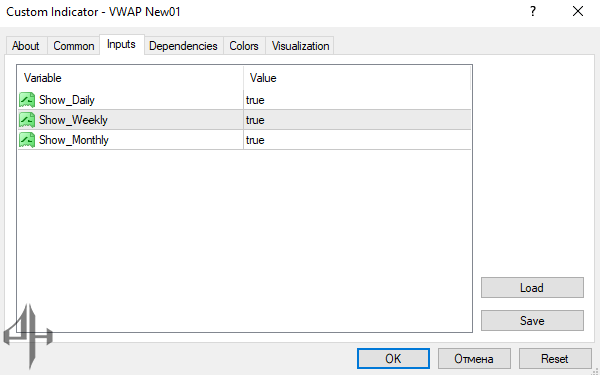
-
Show_Daily: Displays the daily price line.
-
Show_Weekly: Marks the weekly price line.
-
Show_Monthly: Highlights the monthly price line.
Reviews
There are no reviews yet.