No Repaint Indicator, Lock in Accurate Trading Signals
For MT4 platforms, the No Repaint indicator is a swing trading indication. predicts probable buy/sell levels, breakout positions, and price swing zones. MTF chart fit.
- Description
- Indicator Settings
Description
For MetaTrader 4, you may find the No Repaint Indicator swing trading indication. Forecasts possible levels of purchase and sale, as well as price swings and breakouts. A non-repaint fractal indicator called the No Repaint was created to predict exact price swing levels on MT4 charts. Before making trading selections, it also helps you comprehend how the price responds in important support/resistance zones.
The main source of uncertainty for technical analysts, particularly novices, is the price behavior at important market levels. For example, after a possible bullish price breakout, you initiated a purchase order. The price is on the verge of reaching your stop-loss limit, and you later discover it was a false break. Due to a lack of trading experience and market uncertainties, traders frequently struggle to evaluate actual price actions.
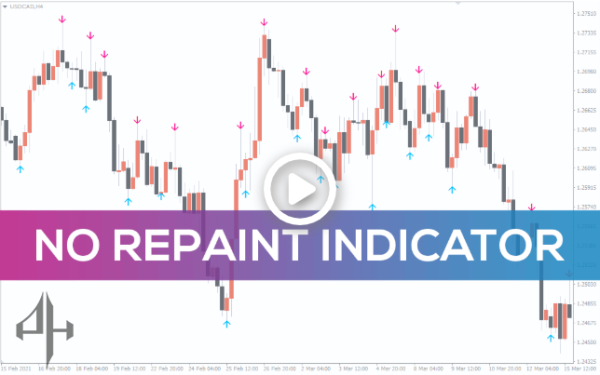
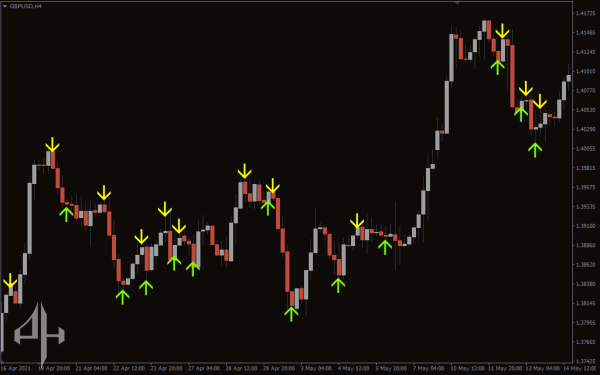
One of the main goals of the No Repaint indication is to depict the current price momentum. Based on recently closed candles, it displays the price’s possible bullish or bearish reversal intents. The chart’s straightforward arrows function similarly to a real-time traffic signal, pointing out the potential future path of market momentum.
This post will teach you how to use the No Repaint indicator on MT4 platforms to trade stocks and FX profitably.
How to use MT4’s No Repaint Indicator to predict possible buy/sell signals
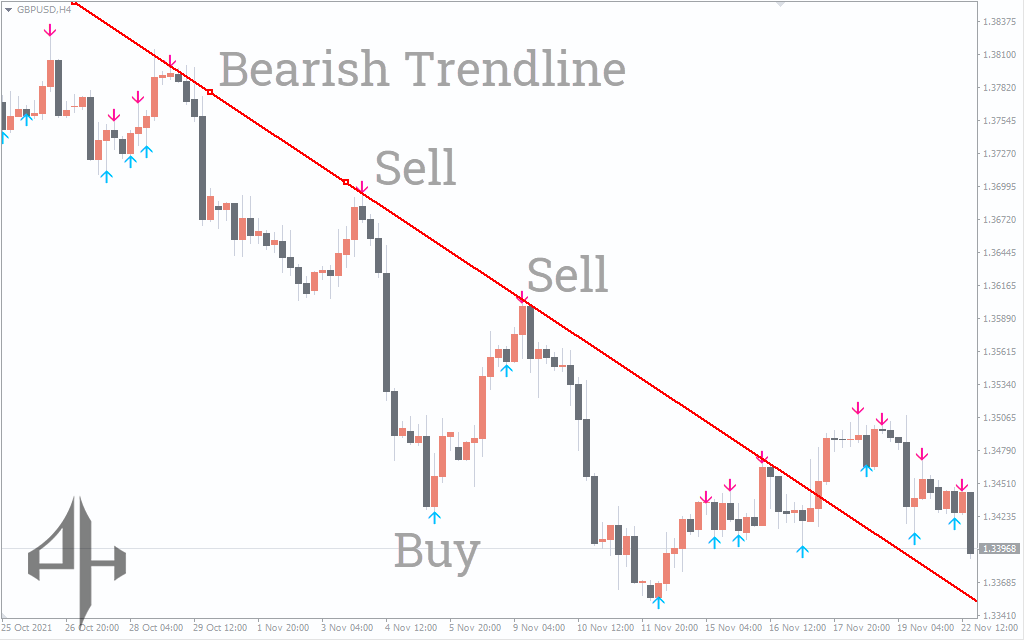
The opening and closing positions of each price candle are closely watched by the No Repaint indicator. It identifies bars that have closed inside the range of the high and low of earlier candles and highlights them as possible indicators of a price reversal.
For instance, a bearish pin bar appears within the last candle’s range. It suggests that the price is awaiting a possible bearish reversal after failing an attempt at a positive advance. An excellent selling opportunity is presented by such a price rejection beneath significant resistance.
We can see a strong downward trend in the GBPUSD 4-hour chart above, where the price was holding up against a bearish trendline. The indicator displays an arrow above the price to signal a downtrend move whenever the candle creates a rejection pattern close to the trendline. In this scenario, if the price breaks the low of the signal candle, you might initiate a sell order. Put a stop-loss limit above the arrow as well. On the other hand, the No Repaint indicator necessitates confirming a buy order by drawing an arrow below the candle’s bottom when the price rejects a support line.
Similar to the buy/sell strategy, you can’t rely on the arrow indications alone to exit a transaction. Therefore, the best way to take profits on an existing order is to wait and see how the price reacts to a specific support/resistance zone.
Conclusion
Unquestionably, a component of technical analysis is comprehending the price movements in important support/resistance zones. By employing straightforward arrows to indicate possible price orientations, the No Repaint indication simplifies things for you. Nevertheless, it plots a lot of alerts and can produce poor indications when the market is turbulent and shelved. In these situations, it is best to use the No Repaint indicator in conjunction with other price action tools such as trendlines, simple moving averages, and support/resistance to improve buy/sell decisions.
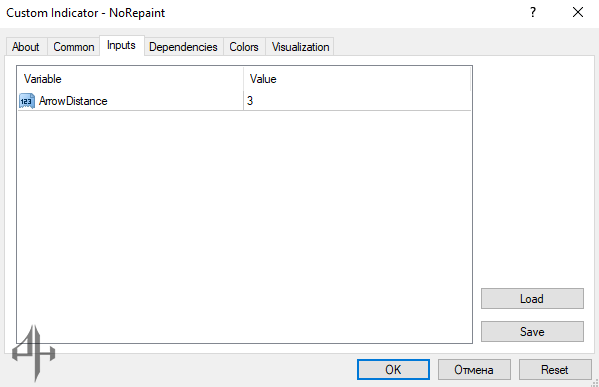
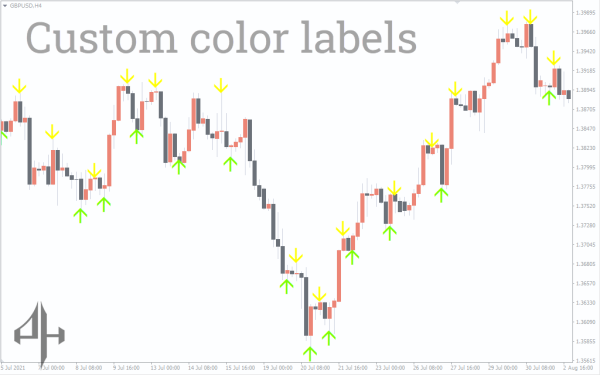
Arrow Distance: Controls how far the arrow signals appear from the price candles on the chart.

