- Description
- Indicator Settings
Description
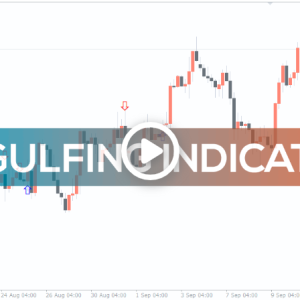
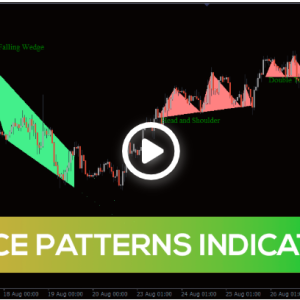
Price patterns indicator that is perfect. A good sign for possible price continuance or reversal. The price patterns created by the FX market mimic forms. The fact that these forms are valued and can be used for profitable trading is very unexpected. In essence, the way various market forces interact determines how the price action takes on these odd shapes. Due to their past testing, these Price Patterns Indicator typically offer traders a competitive advantage.
Finding these market trends is now the challenge. Finding a pattern in the chaotic movements of the forex market is difficult, particularly for novices. The Price Patterns indicator is useful in this situation.
The indicator can be used to trade any pair of currencies. Although the indicator can be used over any period of time, it performs best over a longer period of time. In essence, patterns that emerge on daily, weekly, or 4-hour time frames are typically more powerful.
How to Use the Price Patterns indicator
The Price Pattern indicator looks for different price patterns on the price chart. It makes the patterns easy to recognise by labelling and shading them. More specifically, a good buy signal is a price pattern that suggests a possible trend reversal to the upside.
For instance, you should be prepared to purchase if a triple bottom develops around the support zone. In a similar vein, an uptrend’s triangle pattern indicates that the trend will continue. As a result, you should prepare to add or purchase positions. However, a possible trend reversal into a bearish market is indicated by the head and shoulder price pattern. It is a strong sell signal as a result.
An Example of Trading Price Patterns Indicator
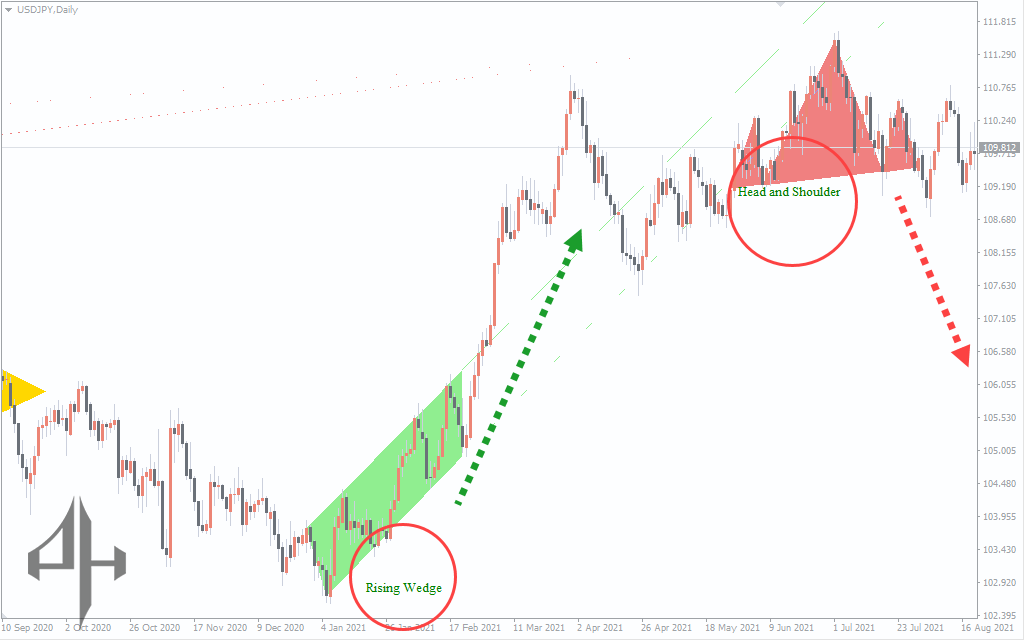
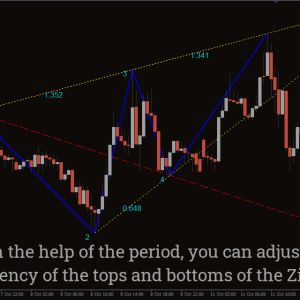
The price movement of the US dollar relative to the Japanese yen is displayed in the above chart. The green-shaded area on the chart represents a rising wedge. A continuance of the trend is indicated by the wedge pattern. In actuality, the price rose sharply following the wedge pattern’s development.
In a similar vein, the area coloured by light coral represents the head-and-shoulders pattern formed by the market. Potential trend reversals into a bear market are indicated by the head and shoulder pattern. As a result, you should be prepared to put a sell order since the bears are expected to push the price lower. Your stop loss should be above the head, or highest peak.
Conclusion
For price action traders, the Price Patterns indicator is a fantastic tool. It saves time and is easy to use. It is not necessary to provide every price pattern. You can see the trends thanks to the indicators. Just make your transaction based on the current signal. Including it in your trading plan makes sense.
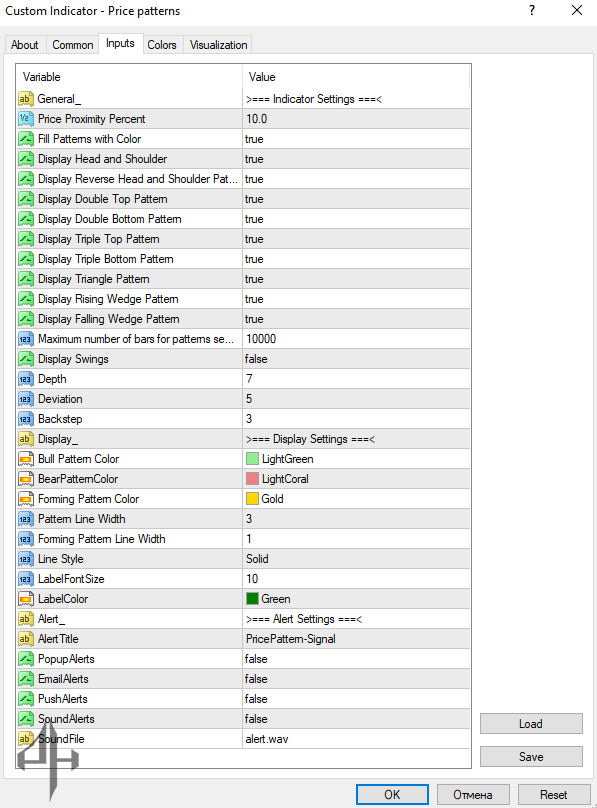
Price Proximity Percent: Increasing this value boosts the indicator’s sensitivity and accuracy.
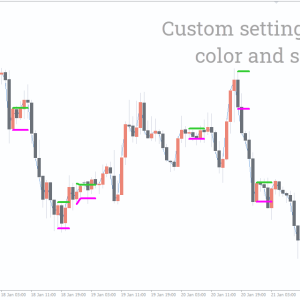
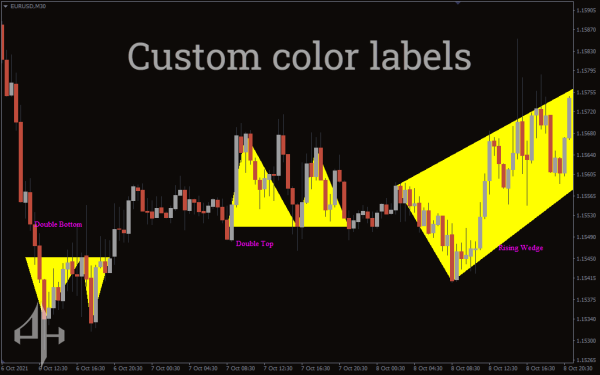
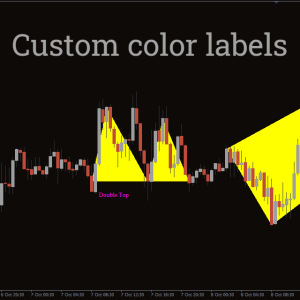
Fill Pattern with Color: Enables shading of identified price patterns.
Display Head and Shoulders: Toggles the display of the head and shoulders pattern.
Display Double Top Pattern: Enables showing the double top pattern.
Display Double Bottom Pattern: Enables showing the double bottom pattern.
Display Triangle Pattern: Allows displaying triangle patterns.
Display Rising Wedge Pattern: Toggles the display of rising wedge patterns.
Display Falling Wedge Pattern: Enables the display of falling wedge patterns.
Maximum Number of Bars for Pattern Search: Sets how many bars the indicator scans for patterns (default is 1000).
Bull Pattern Color: Sets the color for bullish patterns.
Bear Pattern Color: Sets the color for bearish patterns.
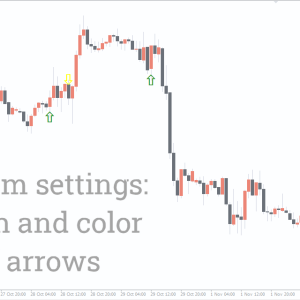
Forming Pattern Color: Defines the color for patterns currently forming.
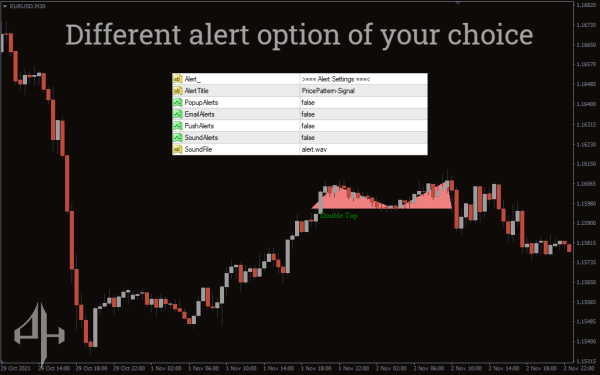
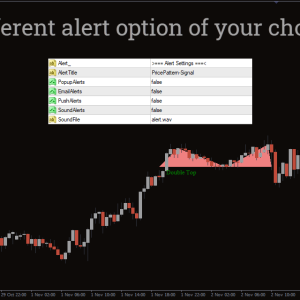
Popup Alerts: Enables or disables popup notifications.
Email Alerts: Enables or disables email notifications.
Push Alerts: Enables or disables push notifications.