- Description
- Indicator Settings
Description
Effective risk management is essential to becoming a profitable and successful trader. Using the Risk to Reward Ratio (RRR) is the most effective method of managing trading risk in forex. Even though this risk management is crucial, many traders find it hard to calculate. The Risk Reward Ratio Indicator removes this challenge.
The Foundation
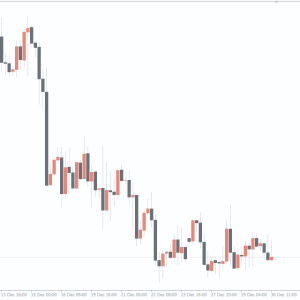
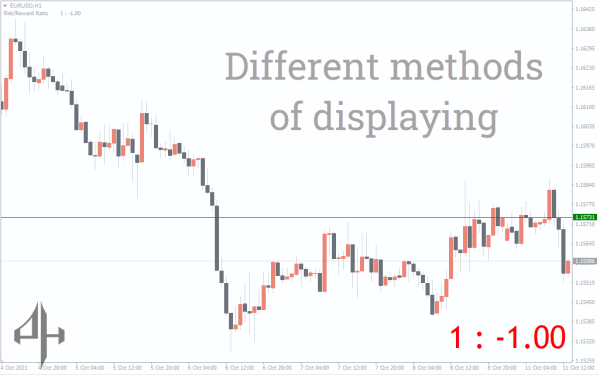
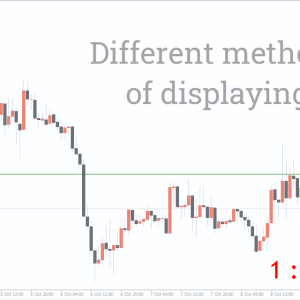
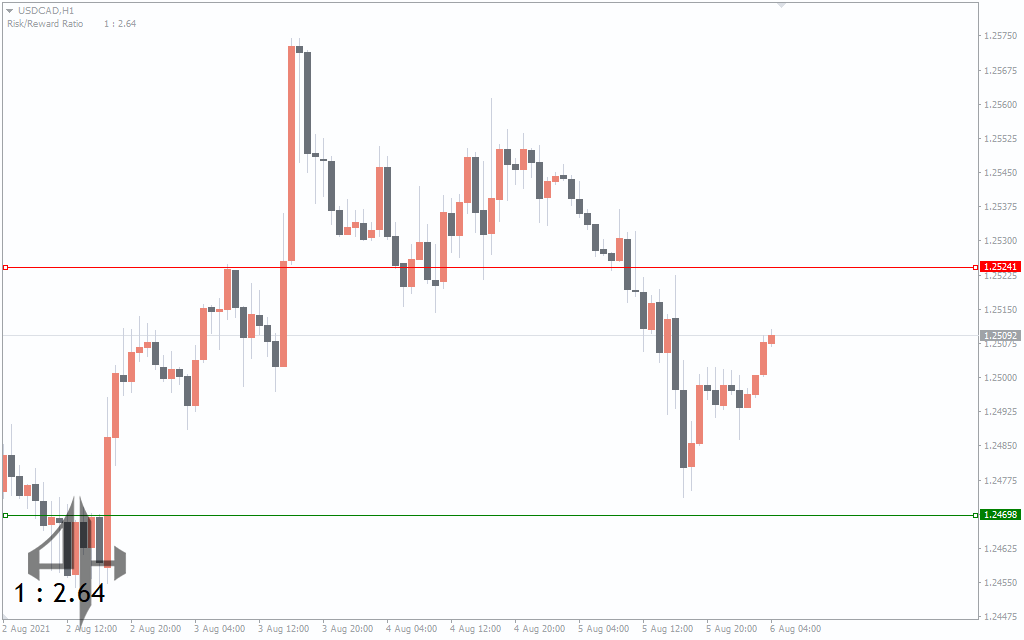
Traders can ascertain the degree of risk exposure and associated payoff by using the Risk Reward Ratio Indicator. The diagram below illustrates how this indicator is shown as a ratio on the main chart:
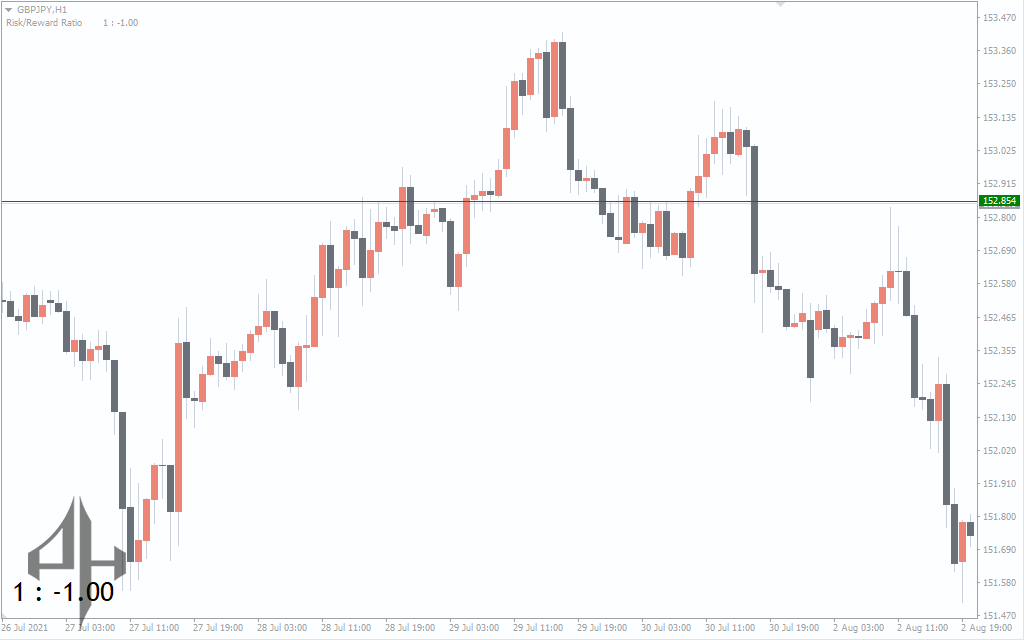
According to the EUR/JPY H1 chart above, the indicator’s RRR is 1:1.94. The risk is represented by the first number (1), and the reward by the second number (1.94).
The indicator further shows three horizontal lines. The take-profit price level (green horizontal line) is the first line. The stop loss price level (red horizontal line) is the second line. Lastly, the bid price is shown as the third line (grey horizontal line) on the chart.
The following formula is used to determine the Risk Reward Ratio Indicator for MT4:
The distinctions between a trade’s entrance and stop loss represent the risk.
- For long trades, risk = Entry price – SL
- For short trade, risk = SL – entry price
- The reward is the difference between the entry and TP.
- For long trades, reward = TP – Entry
- For short trades, the reward is Entry – TP.
The RRR is calculated by dividing the return by the risk.
Since it’s a buy trade, for instance, if you entered a USD/JPY long trade at 125.22 and set your SL and TP at 122.11 and 128.54 respectively, your risk is
SL = 125.22-122.11 = 3.11 for the entry
Your reward is
- TP- Entry= 128.54-125.22 = 3.32.
- Risk is 3.11 and the reward is 3.32.
- RRR = reward/risk = 3.32/3.11 = 1.1
- Therefore, RRR = 1:1.1.
How to use the Risk Reward Ratio Indicator
The three horizontal lines on the chart must first be enabled in order to use the Risk Reward Ratio Indicator for MT4 successfully.
Press CRTL B after dragging the indication to the chart, and then mark the three icons as indicated below.
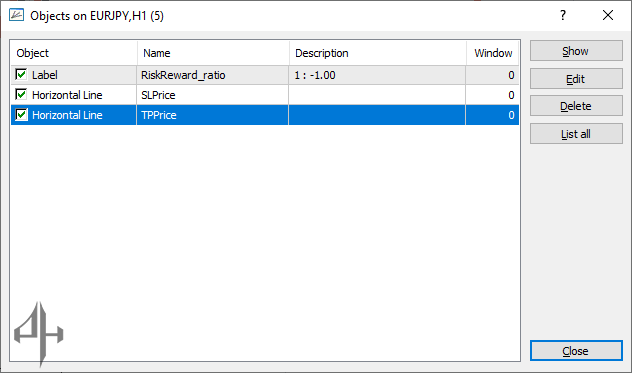
Once these icons are marked, the chart will show the three horizontal lines. To determine the appropriate risk-reward ratio for each transaction, you can also drag the stop-loss and take-profit thresholds. As the take-profit and stop-loss levels are changed, the indicator will automatically show the RRR.
The TP level (green horizontal line) ought to be positioned above the entry point for long trades. On the other hand, the red horizontal line, or SL level, ought to be positioned beneath the entry point.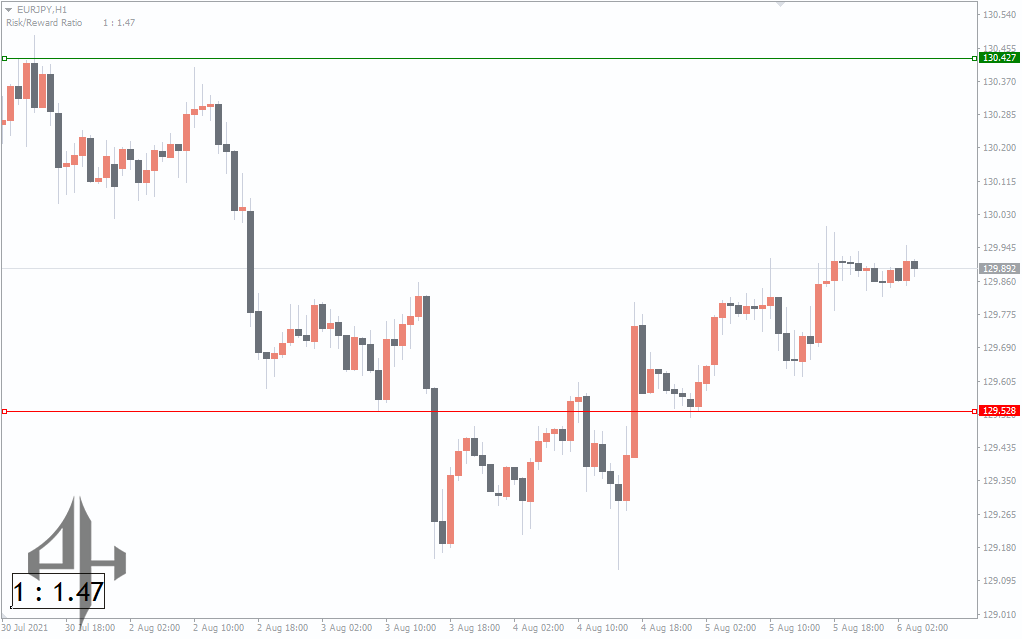
The TP level (green horizontal line) ought to be positioned beneath the entry point for short trades. On the other side, the entry point should be above the SL level, which is represented by the red horizontal line.
Traders can distinguish between profitable and unsuccessful deals using this indicator. A good transaction will have an RRR of at least 1:2. Conversely, bad transactions will have an RRR value below 1:2.
If you incur a risk of 1, your profit will be double your risk, according to the 1:2 RRR. Additionally, if you take a risk of 1, you will receive three times your risk in return. This indicates that your profit will be 3×30 pips, or 90 pips for a 1:3 ratio, assuming your SL is 30 pips. Your profit for 1:2 will be 30×2 = 60 pips if your SL is 30 pips.
This indicator is therefore crucial for evaluating your risk to reward ratio prior to initiating any trades.
Conclusion
For all forex traders, the Risk Reward Ratio Indicator for MT4 is a very helpful tool. With the use of this indicator, traders may ascertain their level of risk exposure in the event that the price moves against them as well as their return in the event that it moves in their favour.
In the MT4 settings, the Risk Reward Ratio Indicator has the following parameters.
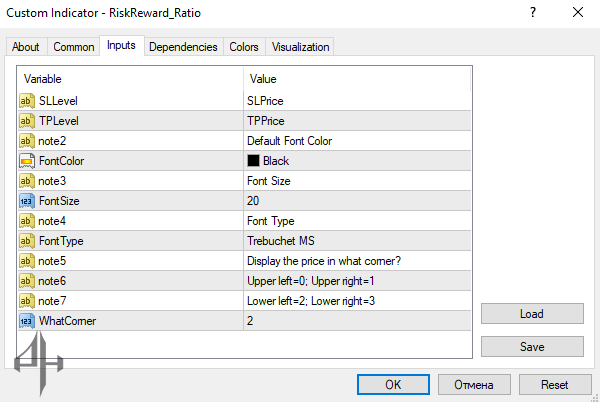
SL Level: Specifies the price level at which the stop-loss is set.
TP Level: Indicates the price level for the take-profit target.
Note 2: Custom user-defined note for additional reference.
Font Color: Determines the color of the text displayed by the indicator.
Note 3: Another user-defined note for additional context.
Font Size: Sets the size of the text displayed on the chart.
Note 4: Additional user-defined note.
Font Type: Specifies the font style used for the indicator’s text.
Note 5: Fifth customizable note for personal reference.
Note 6: Sixth customizable note.
Note 7: Seventh customizable note.
What Corner: Defines the screen corner where the indicator’s text will appear.