
- Description
- Indicator Settings
Description
An RSI divergence indicator alerts traders when price activity and the indicator no longer show the same momentum.
A momentum indicator called the RSI (Relative Strength Index) assesses price movement to determine if the market is overbought or oversold.
The scale ranges from 0 to 100. The market is said to be oversold when the Relative Strength Index falls below 30. The market is considered overbought if the Index value rises beyond 70.
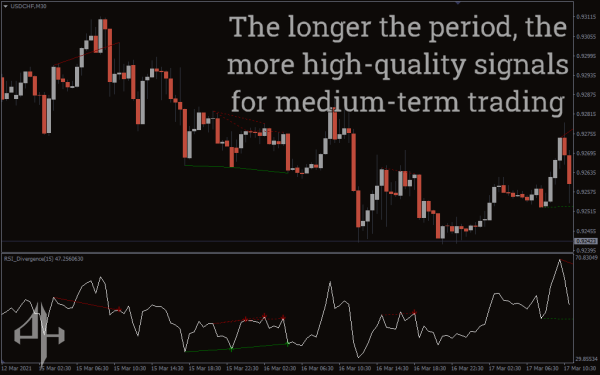
One of the main problems with using an indicator is the absence of signals. The overbought and oversold levels are barely reached by this indicator.
You need to deviate from the conventional indicator in order to combat this issue.
After a downturn, divergence can help you predict when the market is likely to restart its trend.
Lower highs are produced by the chart’s relative strength index when there is an RSI divergence. This happens when the price makes higher highs. Conversely, the indicator displays higher lows when the price hits fresh lower lows.
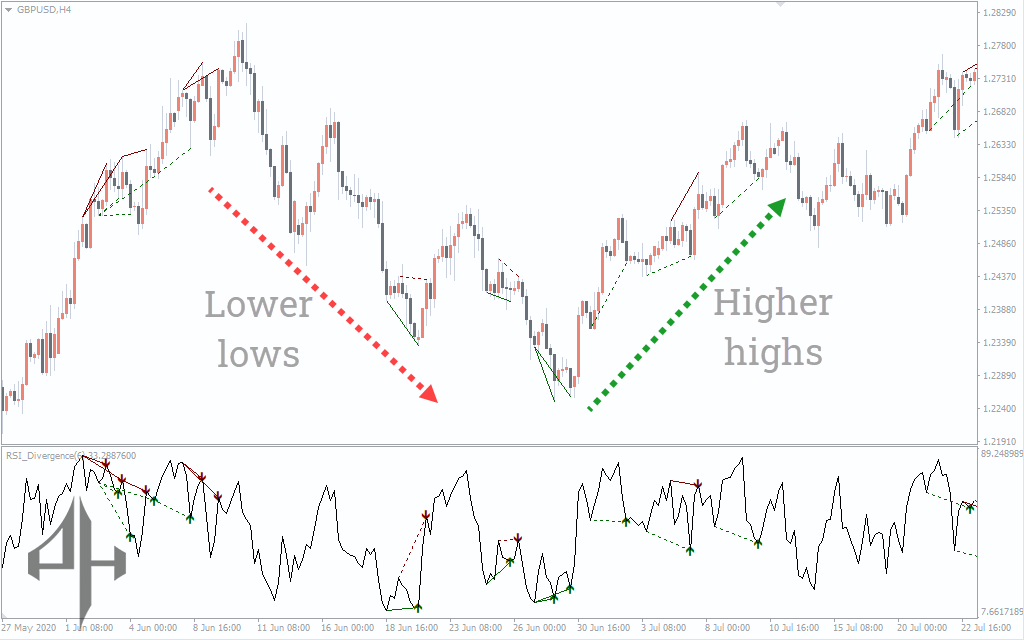
When the Index stops rising to higher highs during an uptrend or falls to lower lows during a downturn, this is known as an RSI divergence.
A divergence suggests that the current trend is no longer strong. This can be a setup and signal to wager on a change in the market price activity’s direction.
When the RSI indicator is oversold, a positive divergence appears, and a higher low that matches lower lows in the price action follows. When the Relative Strength Index indicator is overbought and a lower high that corresponds to higher highs occurs, this is known as a bearish divergence.
RSI Divergence Indicator BUY/SELL Signals
You must look for bullish and bearish divergences in order to use the indicator to find buy or sell signals. We will receive purchase indications from bullish divergence and sell signals from bearish divergence.
Buy signals
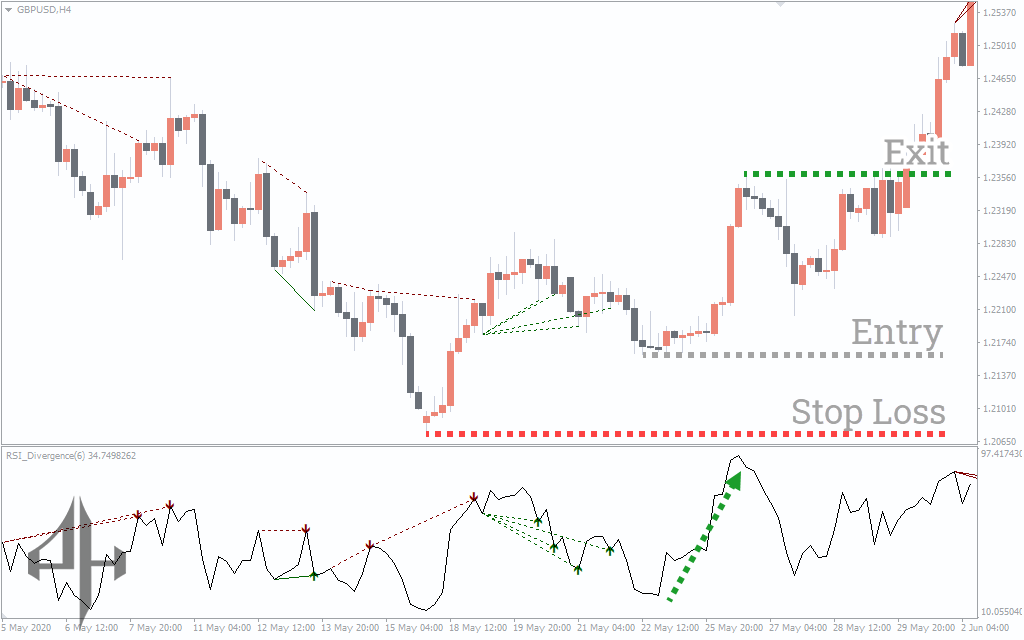
An upward trend is depicted in the above chart. As you can see, when the indicator reaches lower highs and indicates an oversold situation, we enter the trade. This validates a divergence that is positive.
When the RSI reaches the oversold area, you have two options: wait for the confirmation candle or enter the market. When the RSI Divergence begins to decline, you can exit the trade by setting a stop-loss close to the most recent low.
Sell signals
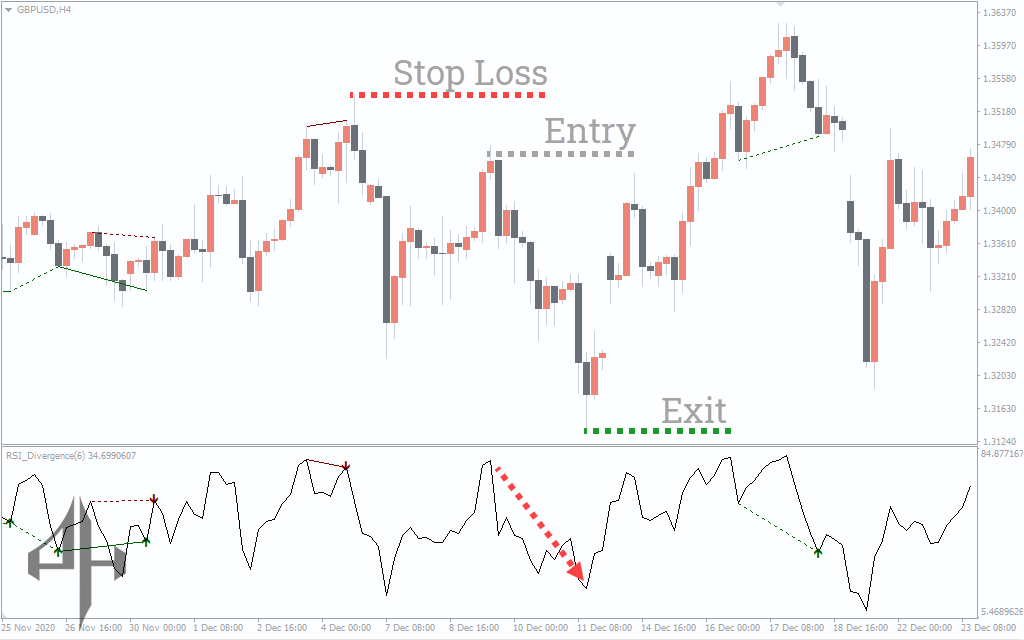
As you can see from the previous chart, an overbought situation occurs when the Divergence Indicator displays higher lows. Although there was a pullback, the price ultimately kept declining.
With a stop-loss close to the most recent high and an exit when the RSI Divergence indicator began to rise, we entered the trade when it indicated an overbought situation.
RSI Divergence indicator on the bottom line
The typical RSI indicator occasionally fails to display overbought and oversold zones and is prone to false alerts. The RSI Divergence Indicator gives you a general picture of where the price may be going next by combining divergences with the traditional RSI.
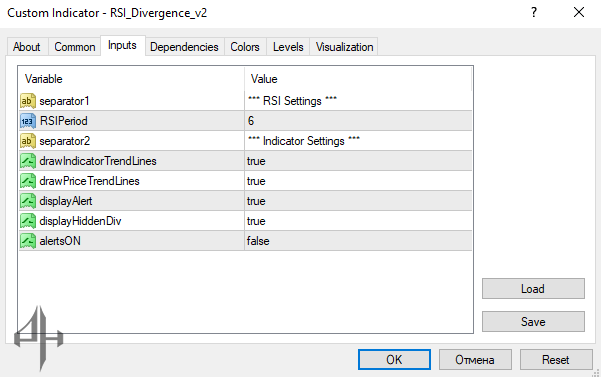
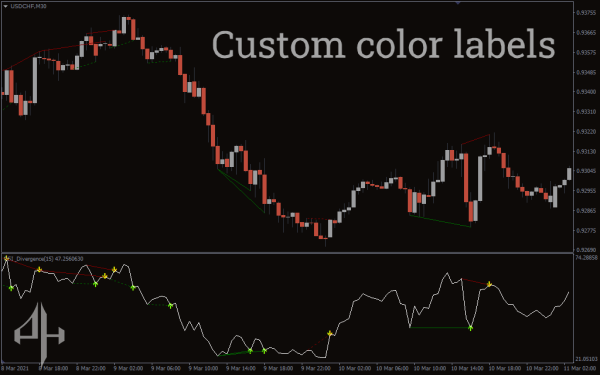
There are various settings for the RSI Divergence Indicator. One of the two separators has an indicator setting, while the other has the RSI value.
Price and indicator trendlines are the two types of trendlines. Divergences are shown on the chart by the price trendline and on the indicator by the indicator trendline.
A trend is shown continuing in the displayHiddenDiv.
DisplayAlert indicates the formation of RSI divergence if it is set to true.