- Description
- Indicator Settings
Description
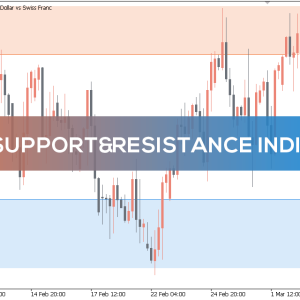
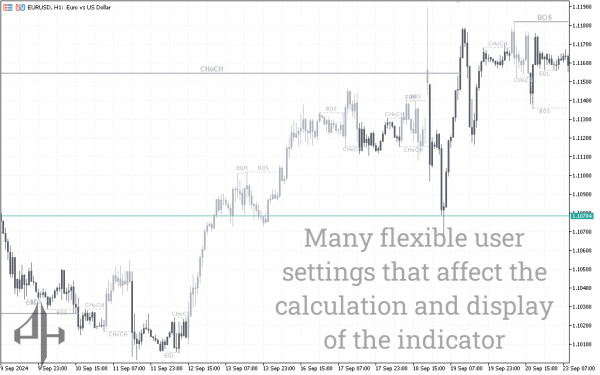
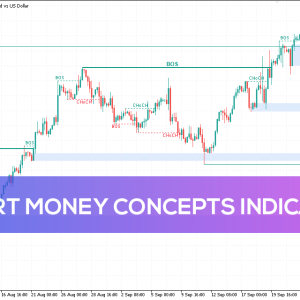
According to Smart Money Concepts (SMC), the Smart Money Concepts Indicator for MT5 is intend to give traders a thorough understanding of the internal structure of the market and assist them in comprehending the main price action patterns. When analyzing institutional trading behaviour, this indicator provides a visual depiction of market events like Break of Structure (BOS), Change of Character (CHoCH), Equal Highs and Lows (EQL), and Order Blocks.
Both seasoned and inexperienced traders who understand smart money concepts can use this instrument. It is adaptable enough for intraday, swing, and long-term trading techniques because it operates on all periods. This indicator assists traders in pinpointing crucial regions for highly accurate trade entry and exit by precisely outlining the market’s structural points.
Trading Signals for Smart Money Concepts Indicators
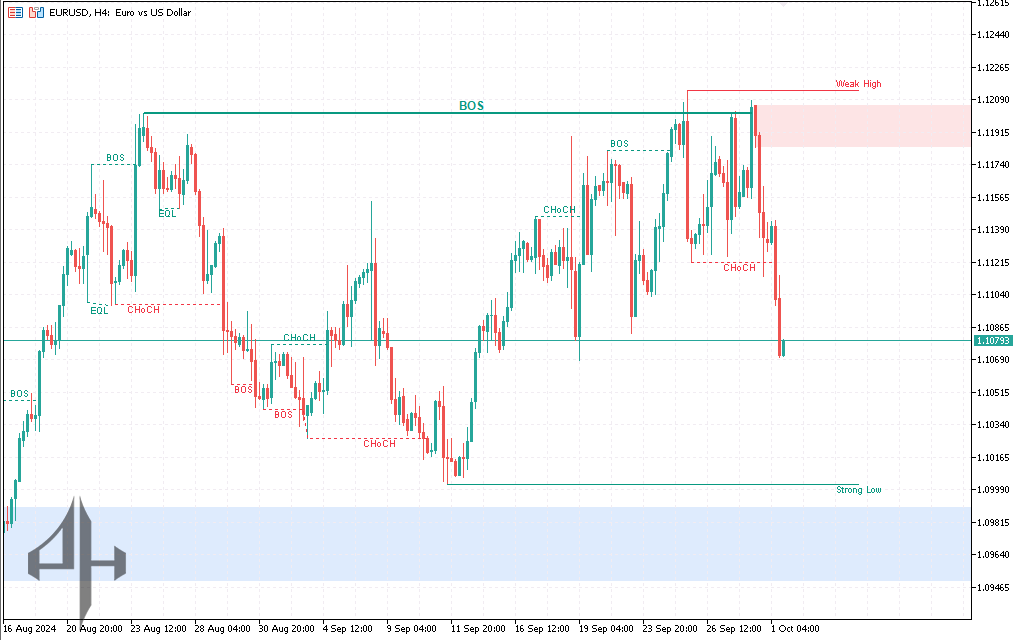
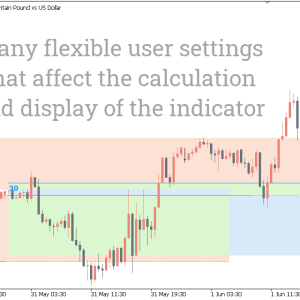
Market structures like BOS and CHoCH, which show significant shifts in the market’s direction, are visualize by the Smart Money Concepts Indicator. For instance, a Change of Character (CHoCH) denotes a change in the market’s internal structure, frequently preceding a reversal, but a Break of Structure (BOS) shows that the market is shifting in a new trend direction. Traders can identify the best trading chances with the aid of these visual clues.
Additionally, Order Blocks—zones of institutional buying and selling—are identify by the indicator, enabling traders to enter transactions at more advantageous pricing. Additionally, it shows Fair Value Gaps (FVG), where the price is anticipated to fill, and Equal Highs and Lows (EQL), which indicate price points where liquidity may be found. These provide additional chances for trading entrances or exits.
By superimposing these structures immediately on the chart, this indicator makes it easier to understand market data. In order to make better decisions and benefit from institutional-level market knowledge, traders might utilise this data to match their tactics with the general behaviour of the market.
Conclusion
For traders wishing to integrate institutional-level information into their trading methods, the Smart Money Concepts Indicator for MT5 is a crucial tool. This indicator assists traders in making more accurate and well-informed trading decisions by giving them clear visual indications of significant market structures such as Break of Structure, Change of Character, Order Blocks, and Fair Value Gaps.
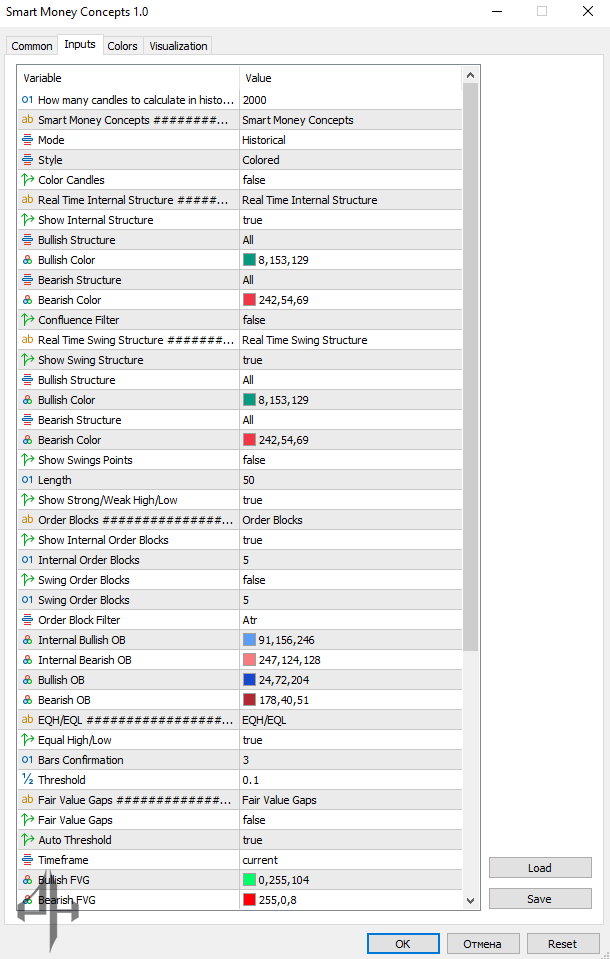
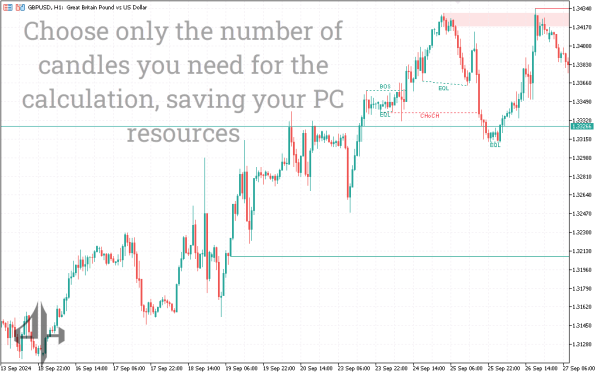
Candle Count for History: Specifies how many candlesticks are analyzed to determine historical market structure.
Mode: Choose between analyzing historical data or monitoring real-time market activity.
Style: Sets the visual style (e.g., solid, dashed, or colored) for internal and swing structures.
Color Candles: Colors candles to reflect the market trend (bullish or bearish).
Show Real-Time Internal Structure: Displays short-term market trends in real-time.
Bullish/Bearish Structure Toggle: Enables or disables the visualization of bullish and bearish patterns.
Bullish/Bearish Color Settings: Customize the color scheme for bullish and bearish structures.
Show Swing Points: Highlights key highs and lows acting as support or resistance.
Highlight Strong/Weak Highs and Lows: Differentiates between strong and weak market levels to assess breakout or reversal potential.
Internal Order Blocks: Displays potential institutional support/resistance zones within smaller price moves.
Swing Order Blocks: Shows order blocks based on broader price swings for long-term analysis.
Order Block Filter: Uses ATR to filter and focus on significant order blocks.
Equal Highs/Lows (EQH/EQL): Marks levels where highs or lows are equal, suggesting liquidity targets.
Fair Value Gaps (FVG): Identifies price gaps likely to be filled during market movement.
Premium/Discount Zones: Highlights overbought (premium) and oversold (discount) areas as potential reversal zones.
Auto Threshold: Automatically calculates key levels for FVGs and other features.
Timeframe: Select the timeframe for the indicator (default is the current chart timeframe).
Bullish/Bearish FVG Colors: Customize the appearance of bullish and bearish Fair Value Gaps.
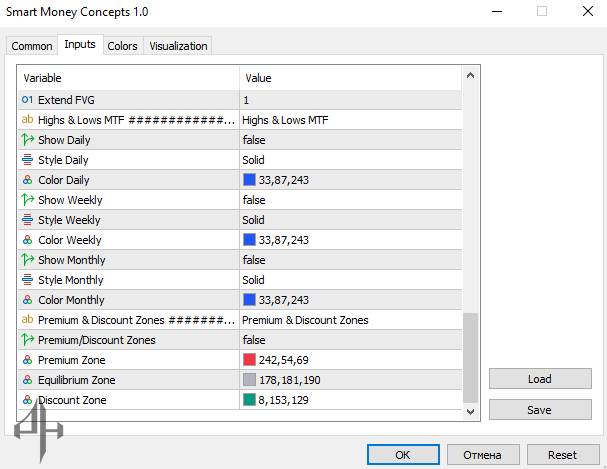
Extend FVG: Controls how far Fair Value Gaps are extended on the chart for clearer visibility.
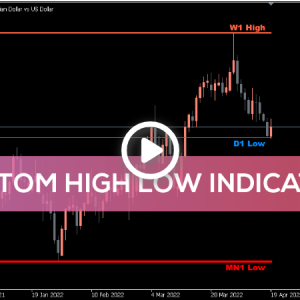
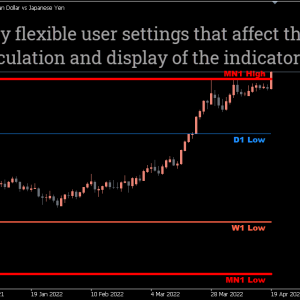
Multi-Timeframe Highs & Lows (MTF): Displays major highs and lows from multiple timeframes.
Show Daily/Weekly/Monthly Levels: Enables or disables visibility of high/low levels for daily, weekly, or monthly periods.
Style for Daily/Weekly/Monthly Levels: Adjust the line style for these key levels.
Color for Daily/Weekly/Monthly Levels: Customize colors to distinguish between timeframes.
Premium/Discount Zone Toggle: Enables the display of zones indicating price extremes.
Premium/Equilibrium/Discount Colors: Customize colors for premium, equilibrium, and discount zones for clarity.