- Description
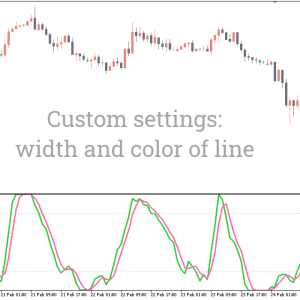
- Indicator Settings
Description
The RSI (Relative Strength Index) and the stochastic indicator are two traditional Metatrader indicators that are combined to create the Stoch RSI Indicator for MT5. Consequently, compared to independent forex RSI or stochastic indicators, the indicator offers superior BUY and SELL trading signals.
The finest entry and exit signals for both bullish and bearish price trends are provided by the indicator’s overbought and oversold levels.
The indicator works best for both novice and seasoned forex traders. The best trading signals may be found by novice forex traders via trading signals. The trading signals of the independent RSI and stochastic indicators can be verified and double checked by experienced forex traders using this indicator.
Furthermore, automated trading systems can make use of overbought and oversold conditions. The indicator is very simple to install and available for free download.
For MT5 trading signals, the Stoch RSI indicator
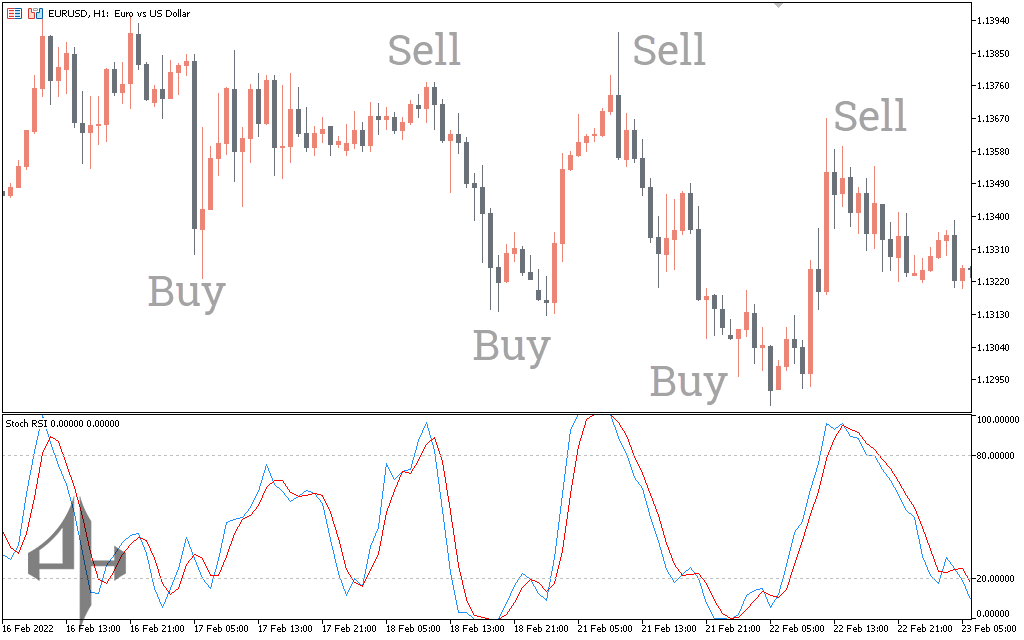
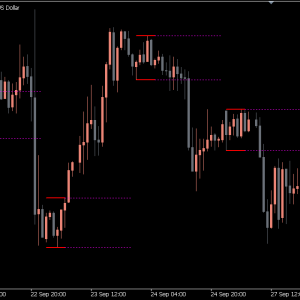
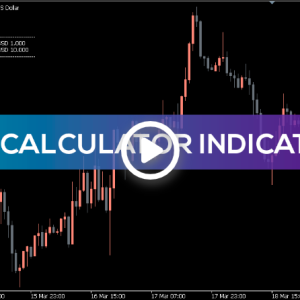
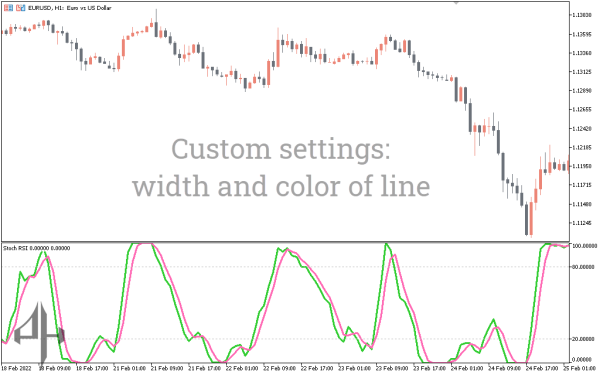
The Stoch RSI indicator for MT5 is displayed in action in the EURUSD H1 chart above. The indicator displays the RSI line in red and the stochastic indicator lines in blue. Additionally, a GRAY dotted line is used to depict the RSI and Stoch RSI Indicator levels.
The indicator uses overbought and oversold levels to generate trading signals for forex. When the RED and BLUE lines rise higher and cross the 20 oversold level, forex traders can enter a BUY position. Traders can keep the position and follow the trend since this signals a BULLISH price trend. Profiting from the overbought indication, which is the opposite signal, is the greatest method to exit this trading technique. On the other hand, traders have the option to set a stop loss below the swing low from earlier.
Similarly, a BEAR market trend is indicated when indicators move lower after crossing overbought levels. As a result, forex traders have the option to execute a SELL trade and keep it open until the indicator hits the oversold level. Throughout the trading session, the price may experience multiple highs and lows. However, traders can utilize the indicator to spot and track the trend for the greatest outcomes.
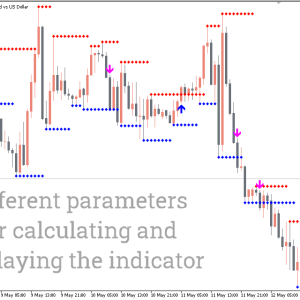
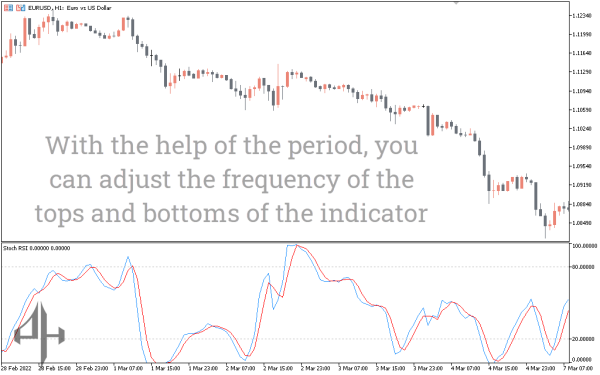
Because every currency pair is unique, forex traders should try out various indicator settings to determine which works best for them. because trade signals for any trading system are largely provided by indicator inputs.
Conclusion
Compared to trading with simply traditional indicators, the Stoch RSI Indicator for MT5 offers genuinely superior trading signals and outcomes. In contrast to the use of the Stochastic indicator or the RSI (Relative Strength Index), bullish and bearish forex trading signals are less frequent. Forex traders can profit from bullish and bearish market conditions due to trading signals’ stability and smoother reactivity.
Automated trading programs can use the indicator’s signals because it doesn’t repaint after the candle closes. It is important for traders to remember that many forex trading techniques are based on the Stochastic and RSI indicators. Additionally, the indicator is available for free download and simple installation for forex traders.
rc=”https://piphunter.io/wp-content/uploads/2025/05/Untitled-1308.png” alt=”” width=”612″ height=”309″ />
K: The period used for calculating the %K line of the Stochastic indicator.
D: The period used for calculating the %D line of the Stochastic indicator.
RSI Period: The period used for calculating the RSI component of the indicator.
Stochastic Period: The overall period setting for the Stochastic indicator.
RSI Applied Price: The price type selected for calculating the RSI.