

- Description
- Reviews (0)
- Indicator Settings
Description
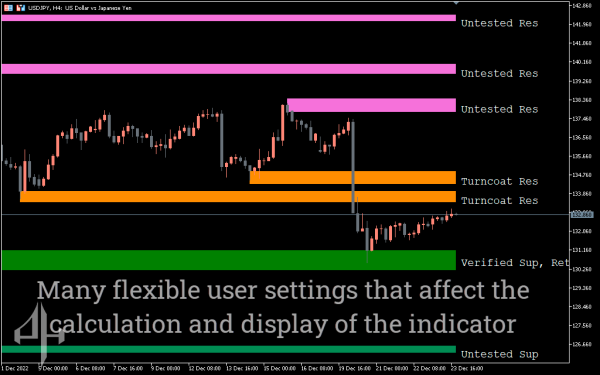
One of the most fundamental concepts a novice forex trader learns is the MT5 supply and demand indicator. Even years after they first formed, the price still responds to these zones because they are so significant. Additionally, a forex trader may not have to worry about sketching each of these historical zones individually while using this indicator.
The supply and demand zones of a currency pair are precisely depicted on the chart by the indicator.
Zones that are not yet impacted are shown by the other zone, which is grayed out. Additionally, a trader can configure the indicator to show the Fibonacci retracement between the zones somewhere in the settings.
How to Use the Supply and Demand Indicator
Using the supply and demand indicator is very simple. You can use this indicator in a similar manner because these zones are essentially support and resistance zones.
Frequently, the price moves into the supply zone and then declines. And it rises as it reaches the demand zone. A trader can therefore profit from this predictability and place bets based on it. Buying on demand and selling on supply is the rule of this trading strategy.
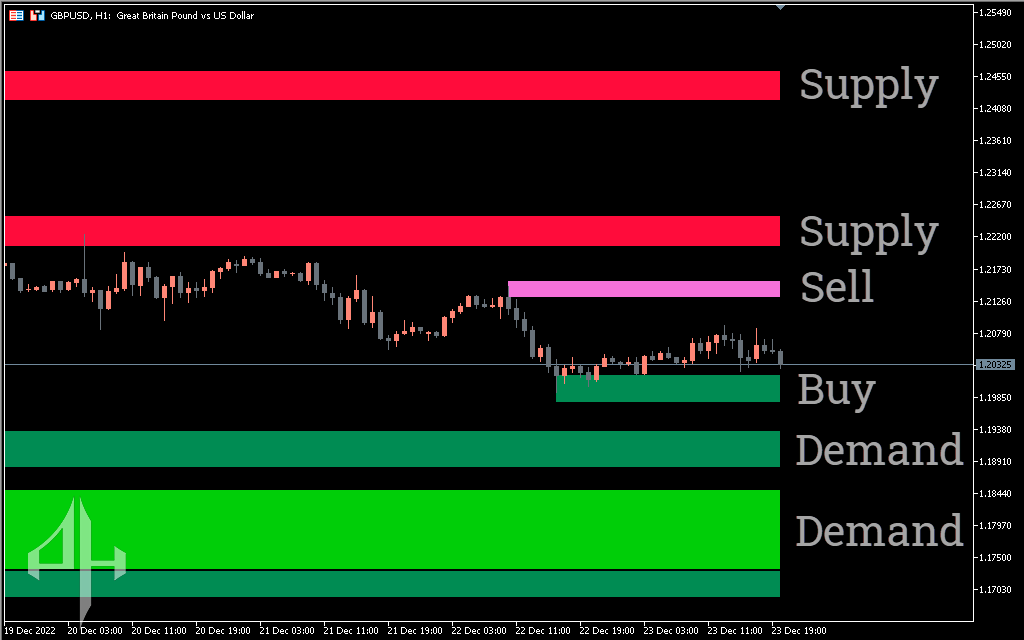
Additionally, just put your reliance in tried-and-true areas. The price has tested the green and red zone at least twice, proving its dependability. You can observe perhaps safe locations in the sea green and orchid zones.
Who is best served by the indicator?
The finest signal for all forex traders is the supply and demand zone. It might be more helpful to novice traders who struggle to identify levels of support and resistance than to those who do not.
Professional forex traders may find this indicator less helpful if they create their zones differently than how they appear on it. Nonetheless, there is no denying this indicator’s accuracy, making it a potentially helpful tool for traders who rely on supply and demand.
Be the first to review “Supply and Demand Indicator, Unlock Trading Success”
These are the Supply and Demand Indicator’s default settings.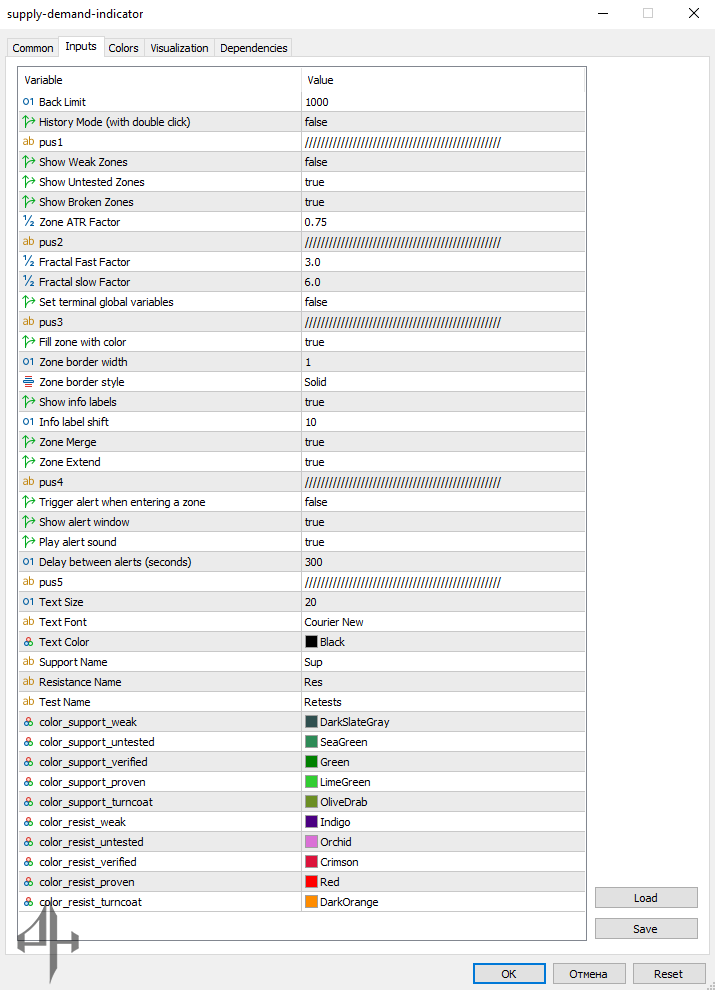
Back Limit: Specifies the number of historical bars used to calculate the indicator.
History Mode: Activates the history mode for the indicator.
Show Weak Zones: Displays weak zones indicated by the tool.
Show Untested Zones: Shows untested zones on the chart.
Show Broken Zones: Displays zones that are broken according to the indicator.
Zone ATR Factor: Adjusts the ATR factor used to calculate the indicator zones.
Zone Strength: Has no visible effect on the chart.
No Weak Zones: Allows you to toggle weak zones on or off.
Draw Edge Price: Shows the currency pair prices at the edge of each zone.
Zone Width: Has no visible effect on the chart.
Zone Fibs: When set to “true” and with “HUDOn” enabled, it shows a Fibonacci retracement tool at the right end of the chart.
Fib Style: Has no visible effect on the chart.
HUD On: Displays a triangle in the bottom left corner of the chart, which points either up or down depending on the price movement between two zones.
Timer On: Has no visible effect on the chart.
Layer Zone: Has no visible effect on the chart.
Layer HUD: Has no visible effect on the chart.
Corner HUD: Specifies where the HUD (Heads-Up Display) should appear on the chart.
Pos X: Changes the horizontal position of the HUD.
Pos Y: Changes the vertical position of the HUD.
Alert On: Triggers an alert when a new zone forms.
Alert Popup: Shows a popup notification for alerts.
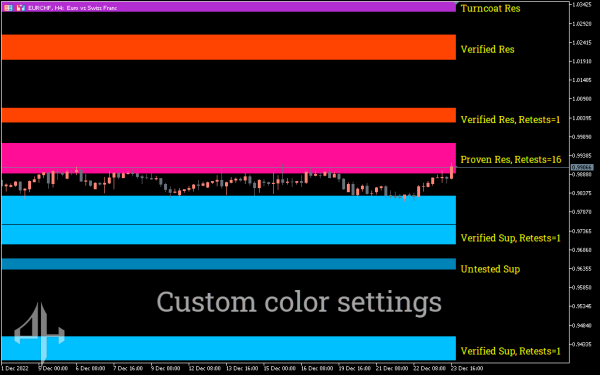
Color Sup Strong: Alters the color of strong supply zones.
Color Sup Weak: Alters the color of weak supply zones.
Color Sup Retouch: Alters the color of retouched supply zones.
Color Dem Strong: Alters the color of strong demand zones.
Color Dem Weak: Alters the color of weak demand zones.
Color Dem Retouch: Alters the color of retouched demand zones.
Color Fib: Changes the color of Fibonacci retracement lines.
Color HUD TF: Modifies the color of the HUD.
Color Arrow Up: Alters the color of the upward arrow.
Color Arrow Down: Alters the color of the downward arrow.
Color Time Back: Changes the color of the timeback element.
Color Timer Bar: Changes the color of the timer bar.
Color Shadow: Modifies the shadow color.
Limit Zone Visibility: Has no visible effect on the chart.
Same TF Visibility: Has no visible effect on the chart.
Show on M1: Has no visible effect on the chart.
Show on M5: Has no visible effect on the chart.
Show on M15: Has no visible effect on the chart.
Show on M30: Has no visible effect on the chart.
Show on H1: Has no visible effect on the chart.
Show on D1: Has no visible effect on the chart.
Show on W1: Has no visible effect on the chart.
Show on MN: Has no visible effect on the chart.
Price Width: Has no visible effect on the chart.
Time Offset: Has no visible effect on the chart.
Global Vars: Has no visible effect on the chart.

Reviews
There are no reviews yet.