- Description
- Indicator Settings
Description
One of the most fundamental concepts a novice forex trader learns is Supply and Demand Zones Indicator. Even years after they were first created, prices still respond to these zones because they are so significant. Additionally, a forex trader may not have to bother about drawing each of these historical zones sequentially when using the supply and demand zones indicator.
The Supply and Demand Zones Indicator for MT4
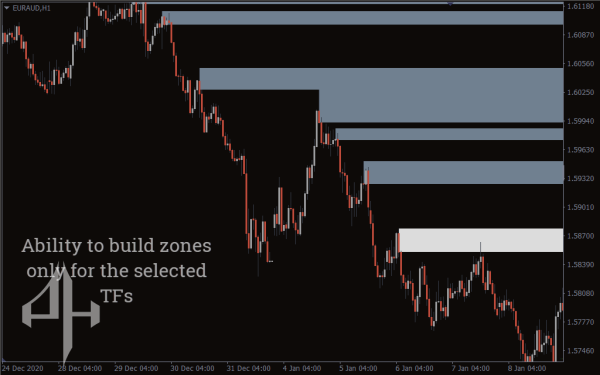
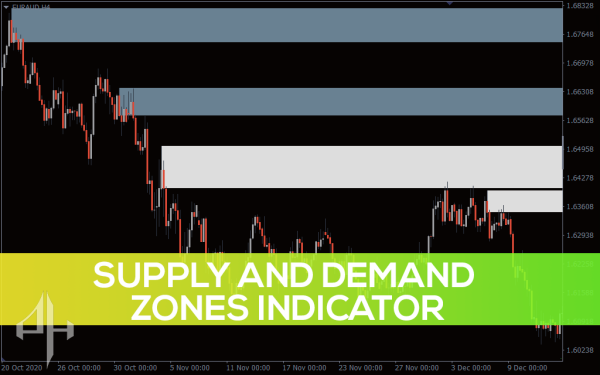
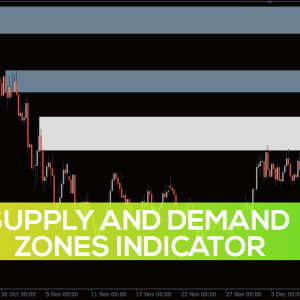
The Supply and Demand Zones Indicator of a currency pair are precisely depicted on the chart by the supply and demand zone indicator. These zones appear on your MT4 in two different hues. One is white, signifying areas that have just undergone retouching. The opposite zone, which is painted grey, represents untouchable zones. Additionally, a trader can adjust the indicator to show the Fibonacci retracement between zones somewhere in the settings.
The Supply and Demand Zones Indicator: How to Use It
It’s really simple to utilize the supply and demand zone indicator. You can use Supply and Demand Zones Indicator in a similar manner because supply and demand zones are essentially support and resistance zones.
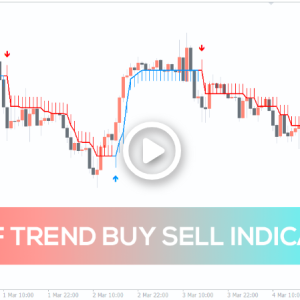
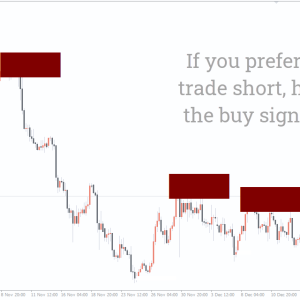
The price frequently hits the supply zone before falling again. And it rises as it reaches the demand zone. Therefore, a trader could profit from this predictability and use it to their advantage. Selling at supply and buying at demand is the rule of supply and demand trade.
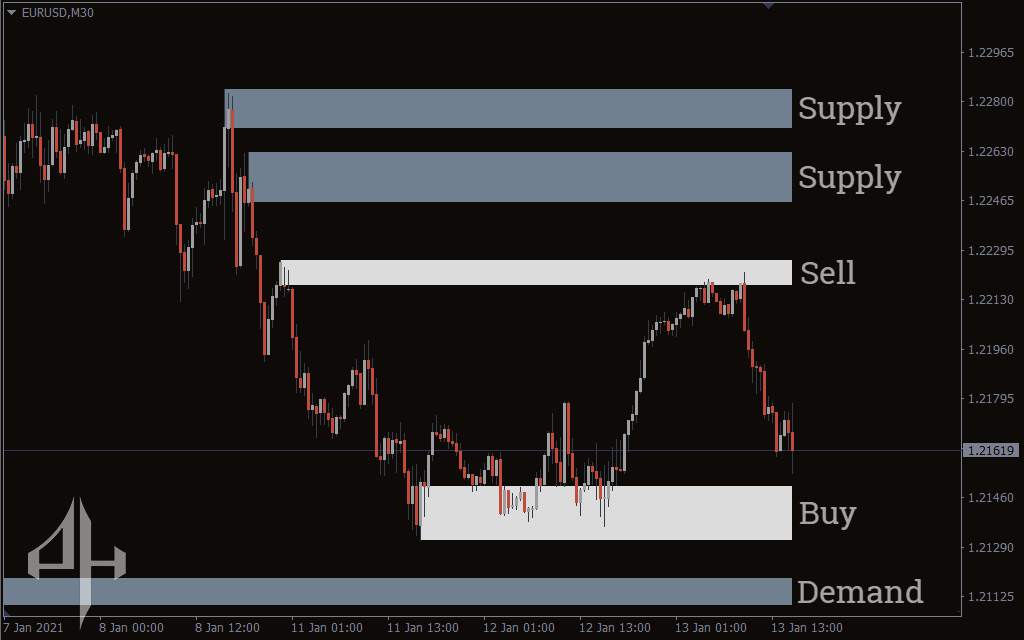
Furthermore, only the retouched (white) zones should be trusted. The price has tested the white-colored zone at least twice, proving its dependability. The grey areas are useful for spotting possible trustworthy areas.
Who Can Benefit Most from the Supply and Demand Zone Indicator?
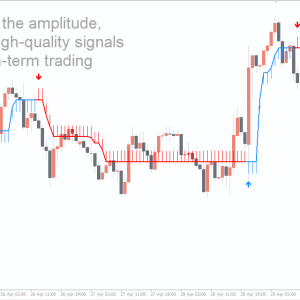
The finest signal for all forex traders is the supply and demand zone. It might be more helpful to novice traders who are struggling to identify levels of support and resistance than to those who are not.
Expert forex traders may find this indication less helpful if they create their zones differently than how they show up on the screen. Nonetheless, there is no denying this indicator’s accuracy, making it a potentially helpful tool for traders who rely on supply and demand.
And let’s talk about the zones once again…
Construction:
Demand Zones: Formed where the price sharply rises, indicating strong buying interest. When revisited, these zones often trigger buying activity.
Supply Zones: Created where the price drops sharply, signaling strong selling pressure. Sellers may become active when the price returns to these zones.
Types:
Fresh Zones: Newly created, untested, and seen as strong because of unfulfilled requests.
Tested Zones: Price-tested zones are still useful but may lose their appeal over time.
Differences from Support and Resistance Levels
Supply and demand zones: are more important in the long run since they cover wider price ranges and are based on volume and market activity.
Levels of Support and Resistance: Particular price points that are more suitable for short-term trading and are frequently identified by past touches.
Pros and Cons
Pros:
Accuracy: Entry and exit points based on actual market action are more trustworthy.
Longevity: Help with long-term trade planning by remaining relevant throughout time.
Cons:
Complexity: More difficult to recognize in the absence of indicators.
Uncertainty: The date of entry may become unclear in broader zones.
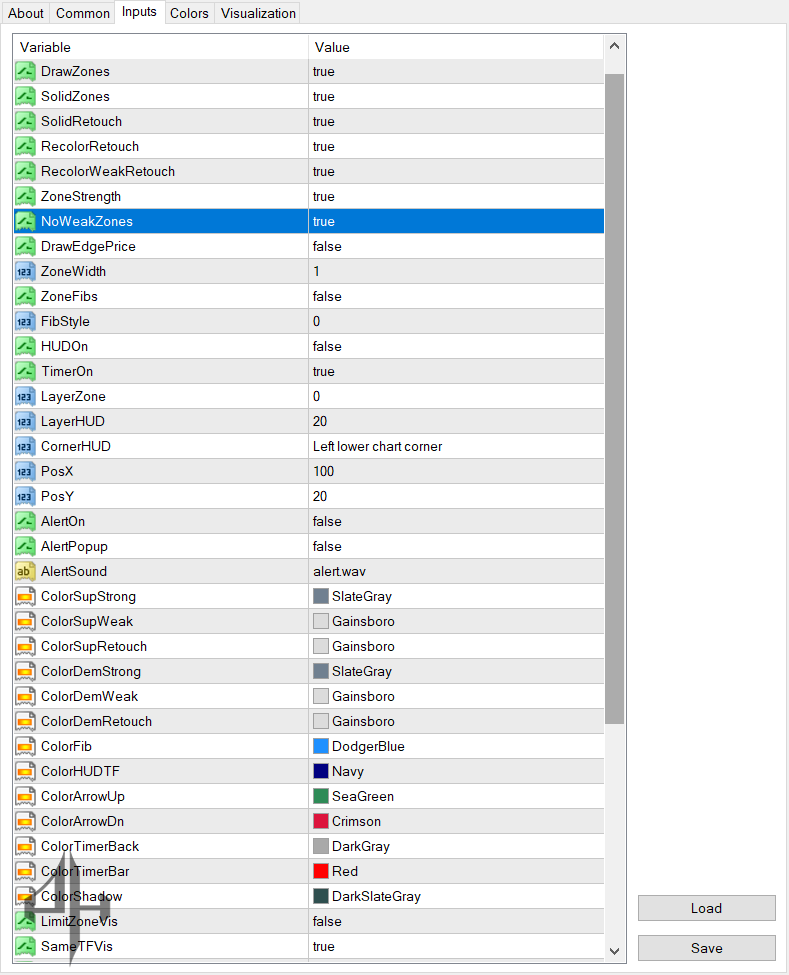
The supply and demand zones indicator comes with these settings.
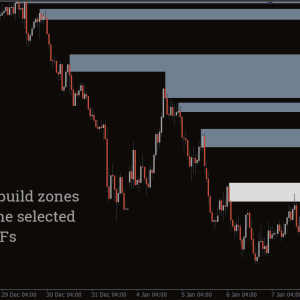
TimeFrame: Select the timeframe’s zones you wish to display on your existing chart.
DrawZones: If “false,” all zones are eliminated from the graphic.
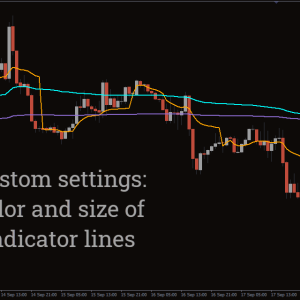
SolidZones: Changes the color of the zones.
SolidRetouch: Enhances or diminishes color in retouched areas.
RecolorRetouch: Allows retouched areas to acquire a new hue.
RecolorWeakRetouch: Adds new color to weak retouched areas.
ZoneStrength: The chart shows no discernible impact.
NoWeakZones: This lets you add or remove weak zones.
DrawEdgePrice: Positions the prices of currency pairs at each zone’s edge.
ZoneWidth: The chart shows no discernible change.
ZoneFibs: When set to “true” and “HUDOn,” this feature shows a Fibonacci retracement tool at the chart’s right end.
FibStyle: The chart shows no discernible change.
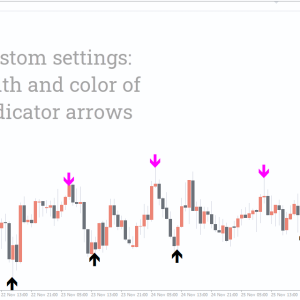
HUDOn: Puts a triangle at the bottom left corner of the chart that is either upright or upside down, depending on the price direction within two zones.
TimerOn: The chart shows no change.
LayerZone: The chart shows no discernible impact.
LayerHUD: The chart shows no discernible impact.
CornerHUD: Describes the position where the HUD should be displayed.
PosX: Modifies the HUD’s position.
PosY: Modifies the HUD’s position.
AlertOn: Alerts you when a zone forms.
AlertPopup: This displays an alert popup.
ColorSupStrong: Modifies the strong supply zones’ color.
ColorSupWeak: Modifies the weak supply zones’ color.
ColorSupRetouch: Modifies the retouched supply zones’ color.
ColorDemStrong: Modifies the hue of the areas with high demand.
ColorDemWeak: Modifies the weak demand zones’ color.
ColorDemRetouch: Modifies the retouched demand zones’ color.
ColorFib: Modifies the Fibonacci retracement’s color.
ColorHUDTF: Modifies the HUD’s color.
ColorArrowUp: Modifies the Up arrow’s color.
ColorArrowDn: Modifies the Down arrow’s color.
ColorTimeBack: Modifies the color of the timeback.
ColorTimerBar: Modifies the color of the timer bar.
ColorShadow: Modifies the color of the shadow.
LimitZoneVis: The graphic shows no discernible impact.
SameTFVis: The chart shows no discernible change.
ShowOnM1: The chart shows no discernible change.
ShowOnM5: The chart shows no discernible change.
ShowOnM15: The chart shows no discernible change.
ShowOnM30: The chart shows no discernible change.
ShowOnH1: The chart shows no discernible impact.
ShowOnD1: The chart shows no discernible change.
ShowOnW1: The chart shows no discernible change.
ShowOnMN: The chart shows no discernible impact.
PriceWidth: The chart shows no discernible change.
TimeOffset: The chart shows no discernible change.
GlobalVars: The chart shows no discernible impact.