Support and Resistance Indicator, Unlock Your Trading Potential

A trend reversal indicator is used. Support and Resistance Indicator that is automatic. Totally free forex indicator.

Updated: 

Description

In the realm of financial trading, support and resistance are the fundamental and frequently employed trading tactics. The greatest technical tool for locating possible locations within a support or resistance zone is MetaTrader’s Support and Resistance indicator.

Support and Resistance Indicator is a multi-timeframe indicator that automatically looks for support and resistance zones over a variety of timeframes. In every time frame, it shows the lines of the support and resistance zones for a given duration. This suggests that, for example, on an H4 period, the indicator would display the support and resistance lines of H4, D1, W1, and MN.

Trading support and resistance zones on your MT4 chart is made easier by this technical indicator, which automatically recognizes and draws the zones.

This indicator is applicable to a variety of trading strategies, including swing, day/intraday, and scalping. Additionally, the indication would be a huge help to new traders who are still learning how to recognize these zones. Additionally, the indicator would help advanced traders save more time.

How Can Support and Resistance in Forex Be Spotted?

The market’s highs and lows are where significant support and resistance are found. This suggests that higher highs are possible resistance zones and lower lows are possible support zones. Additionally, the price’s physiological levels (rounded figures, such as 1.4200, etc.) could be support or resistance zones.

How Do You Draw Support&Resistance Lines?

Either a trend line or a horizontal line is used to define support and resistance lines. Drawing a line that joins at least two peaks or troughs is the goal.

How To Trade With The Support and Resistance Indicator

Support and Resistance Indicator

The indicator’s appearance on your MT4 chart is depicted in the screenshot above. The support and resistance zones from the various timeframes are shown by the several lines. The DODGER BLUE lines represent the support zones, and the RED lines represent the resistance zones. Experts in MT4 trading

Both trend continuation and trend reversal can be traded using the indicator. A broken support zone can turn into a possible resistance zone, and vice versa. This implies that when the price bounces off the indicator, you can search for a trend reversal pattern for a BUY/SELL entry. Similarly, you might as well search for a price continuation pattern (such as a lightning bolt pattern) and initiate a buy or sell trade in the direction of a broken resistance or support.

Conclusion

Technical analysis is made easier with MT4’s Support and Resistance Indicator. With only a brief look at your chart, you can identify possible support and resistance zones. Lastly, there is no cost to download the indicator.

Reviews

There are no reviews yet.


Be the first to review “Support and Resistance Indicator, Unlock Your Trading Potential”

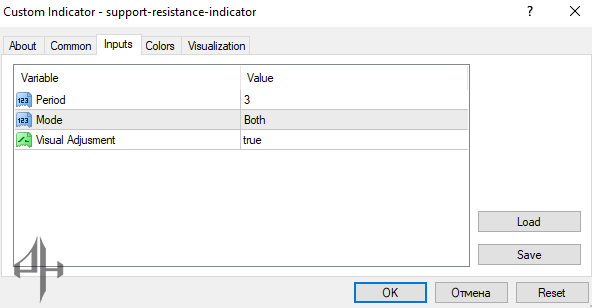
The indicator offers several customizable settings that enable users to adjust the parameters as needed. Additionally, it is recommended to enable “Allow DLL imports” after installing the indicator.

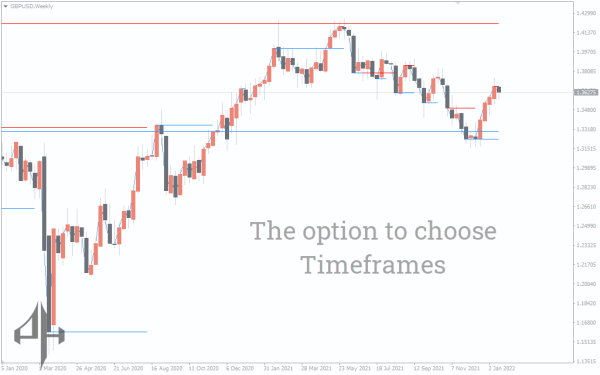
Period: Displays the period value currently applied by the indicator.

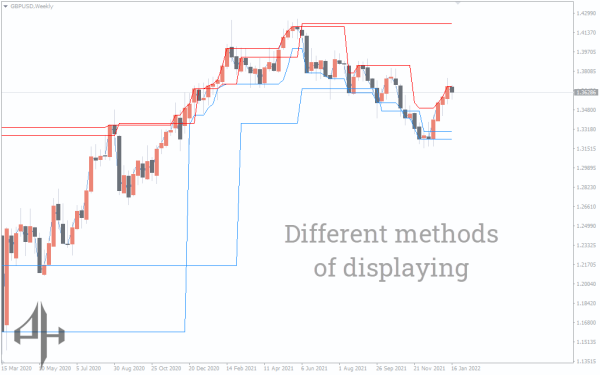
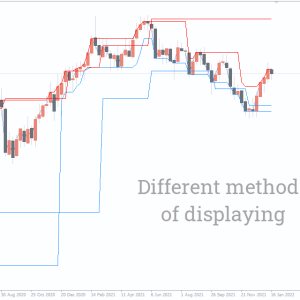
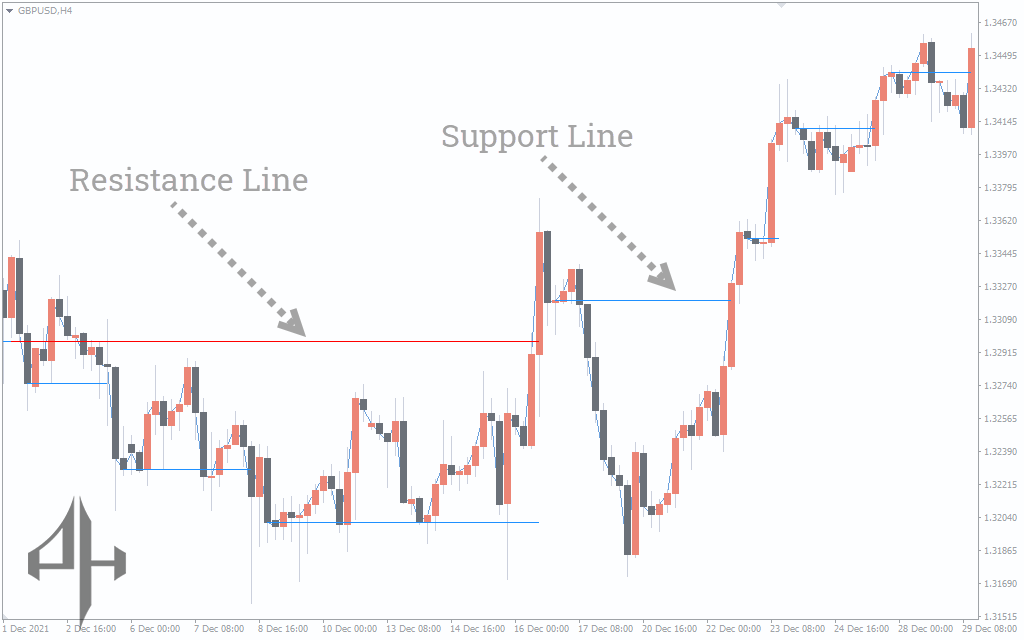
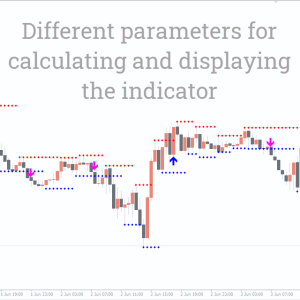
Mode: This setting determines whether the support/resistance lines are shown in consolidated or unconsolidated mode.

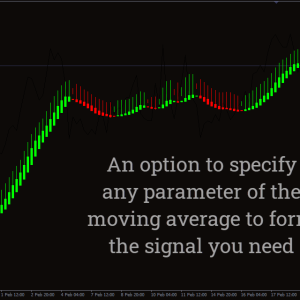
Visual Adjustment: This option controls the way the lines are visualized on your chart.

Related Products