
- Description
- Reviews (0)
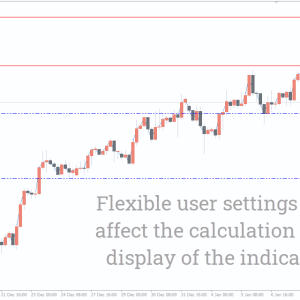
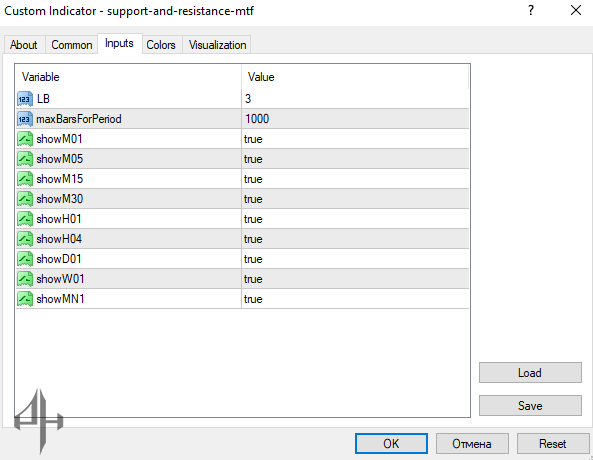
- Indicator Settings
Description
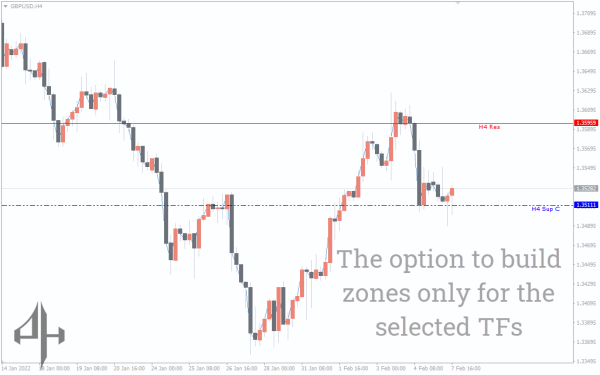
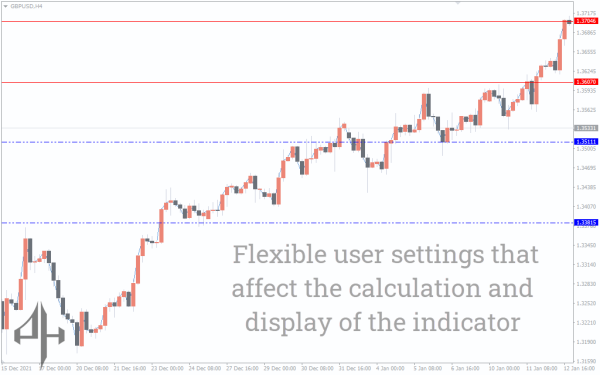
A forex trader can view the support and resistance of several time frames (mtf) on a single price chart by using the Support and Resistance MTF indicator for MT4. When the levels of support and resistance correspond to different time periods rather than just one, they become even more robust and consistent. For instance, in an H4 price chart, H1 support and resistance gain strength if they show up at the same price level. Forex traders may use this indicator to find the ideal entry point to BUY and SELL by identifying the multi-timeframe (mtf) support and resistance in the current price chart.
The indicator performs well on daily, weekly, and monthly charts as well as any intraday time frame price charts. This indicator helps both novice and experienced forex traders quickly determine the optimum entry and exit locations as well as bullish and bearish trends. Additionally, the indicator can be used for auto trading techniques by technical forex traders.
MT4 Trading Signals Support and Resistance MTF Indicator
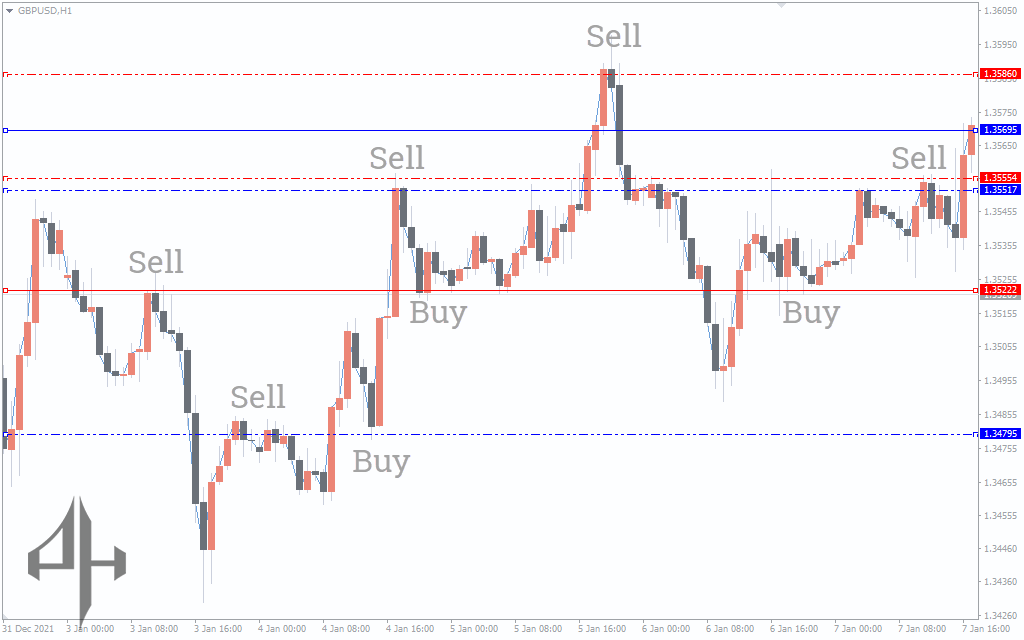
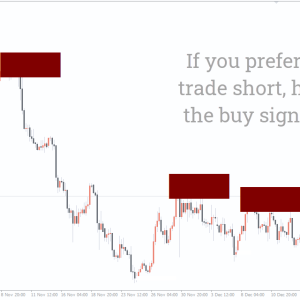
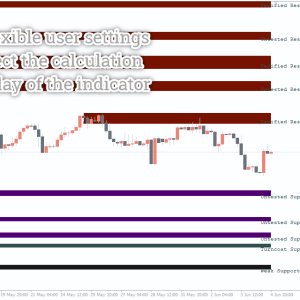
The Support and Resistance MTF indicator for MT4 is active in the GBPUSD H1 price charts above. Furthermore, the indicator displays red dotted lines for resistance and blue lines for support.
Breakout and reversal trading are the two trading strategies used to identify support and resistance. Nevertheless, price action is used in both of these approaches to verify further confirmation.
Traders expect a bullish trend and enter the market with a BUY trade if the price breaks a barrier level. The take-profit is at the next resistance, while the stop loss is below the support level.
In a similar vein, if the price breaches a support level, forex traders can initiate a SELL position, signaling a bearish price trend. It is advisable for traders to book profits at the support and place a stop loss above the resistance.
However, if the price is unable to overcome resistance, it signifies that purchasers have failed. Forex traders therefore expect the sellers to become stronger and begin selling.
In a similar vein, if the price does not break support, it suggests that buyers are getting stronger and sellers are getting weaker. Because it indicates a bullish market to follow, this justifies a buy trade.
Conclusion
In order to determine the stop loss and take profit levels, the support and resistance MTF indicator for MT4 offers the optimum entry points. Additionally, they help forex traders recognize bullish and bearish trends, as well as their reversals, so they can buy and sell appropriately. The indicator can also be downloaded and installed for free.
Be the first to review “Support And Resistance MTF Indicator, Master Key Market Levels Across Timeframes”
-
LB: The indicator uses the candle close price for its calculations.
-
maxBarsForPeriod: Specifies the number of historical bars to analyze.
-
ShowM01: Calculates support and resistance levels for the 1-minute period.
-
ShowM05: Calculates support and resistance for the 5-minute timeframe.
-
ShowM15: Uses support and resistance levels from the 15-minute chart.
-
ShowM30: Displays support and resistance values for the 30-minute period.
-
ShowH01: Enables the display of support and resistance levels for the 1-hour timeframe.
-
ShowH04: Shows support and resistance levels on the 4-hour chart.
-
ShowD01: Indicates support and resistance levels on the daily chart.
-
ShowW01: Displays weekly support and resistance levels.
-
ShowMN1: Shows support and resistance levels for the monthly timeframe.
Reviews
There are no reviews yet.