- Description
- Indicator Settings
Description
Curiously, the MT5 terminal does not by default have an indication that would automatically construct levels of Support&Resistance Indicator. After all, a lot of traders use technical analysis, and these levels are one of its essential components. This issue is resolved with an automatic support and resistance indicator.
Description of the Support&Resistance Indicator
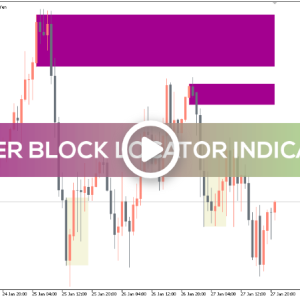
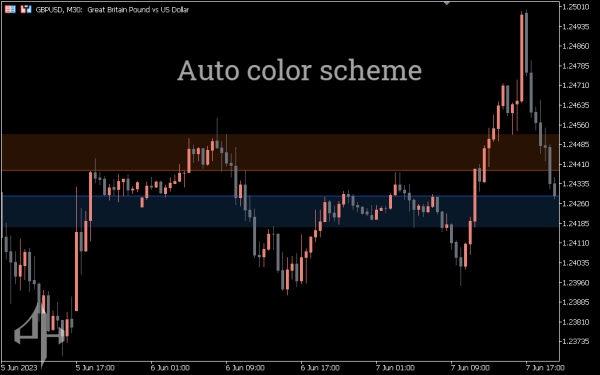
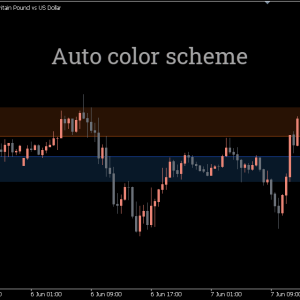
Important SR levels are automatically displayed on the chart by the support and resistance indicator.
The chart displays support levels (zones) in blue and resistance levels (zones) in red. Support levels show potential buyers’ interest as the price gets closer to them.
Conversely, resistance levels suggest that sellers might be interested when the price gets close to them.
When examining the chart, you can save time and effort by having the indicator automatically draw the real levels of support and resistance. This will undoubtedly be a huge benefit for traders of all skill levels.
When closing positions (stop loss and take profit), the indicator’s SR levels can be used as a guide for placing orders. They also aid in identifying the opening trade indications.
Technique for drawing Support&Resistance Indicator
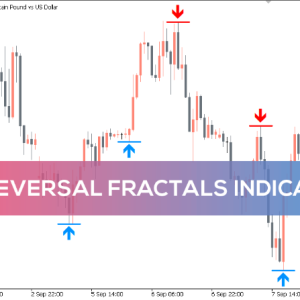
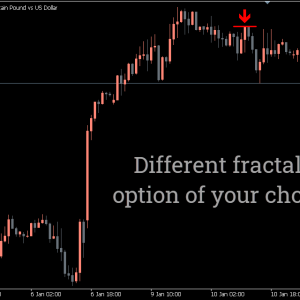
Typically, market extremes, or “fractals,” are used to construct levels of support and resistance. The Fractals indicator is part of the MT5 terminal’s standard set of indicators. It exhibits these extremes.
A fractal indication is already included in the SR indicator. The points with the highest number of fractals are used to construct SR levels.
In this instance, the resistance level is based on eleven fractals. By clicking on the number at the start of the resistance level, you may see which fractals it is built on.
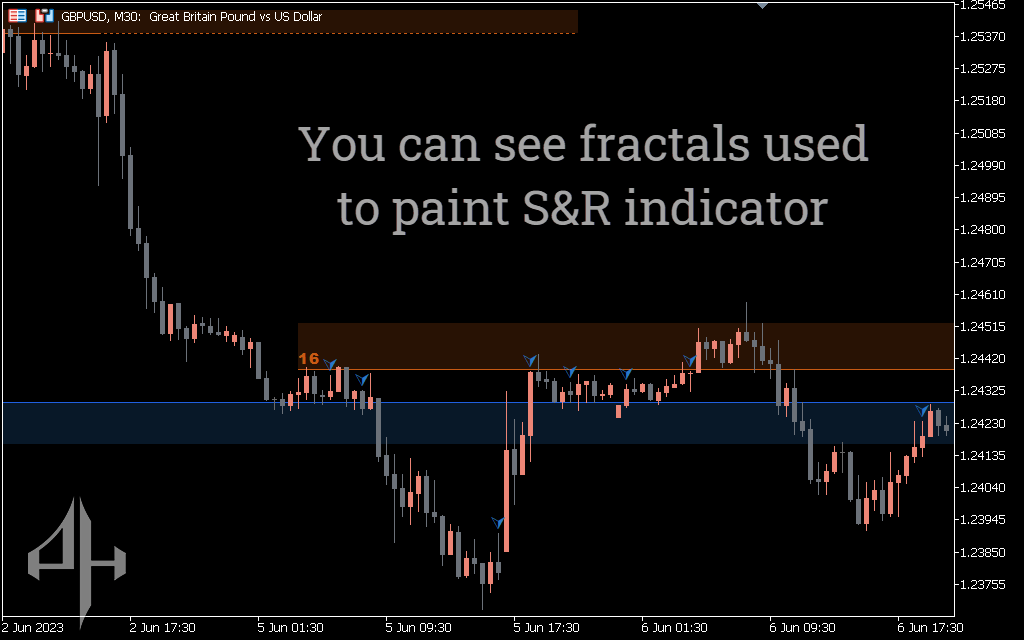
The distance between the fractals determines the height of the resistance and support levels.
The height of the created level will increase with the separation between the upper and lower fractals of the support/resistance level.
Conversely, the height of the fractal will decrease as the higher and lower level fractals get closer to one another.
Therefore, when new fractals emerge, the indicator modifies the height of the levels rather than redrawing.
How to use the Support&Resistance Indicator when trading
SR zone-based trading strategies are frequently displayed as breakout or bounce signals. The details of trading these strategies change for trend and flat, though.
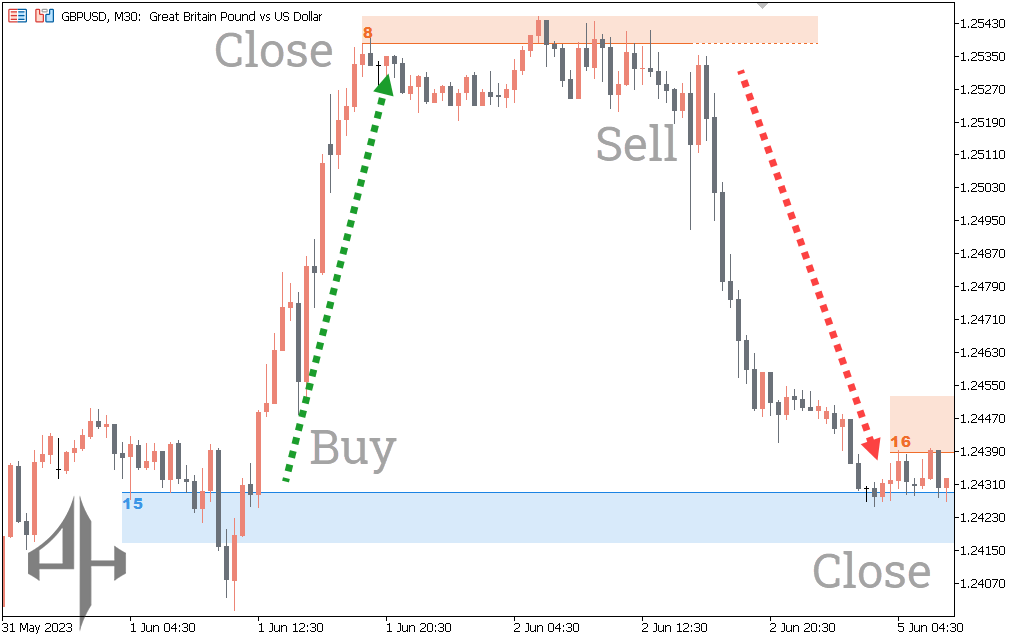
One of the easiest and most successful trading methods is often to trade from the bottom of the flat to the top and back.
However, it’s critical to realize that flat is a transient occurrence in the currency market. The flat will eventually give way to a trend.
In this instance, the Support&Resistance Indicator zones combine to create a little flat.
Technical analysis indicates that the direction in which the trend was orientated prior to the flat has a better chance of producing a flat breakout. As a result, we believe that the likelihood of the resistance zone breaking is a more plausible scenario than a decline.
This enables you to think about buying opportunities from the trading day’s support zone. Additionally, it enables you to think about transactions for a medium- to long-term breakdown of the flat.
SR zones function as levels during an active trend. You can trade well in the direction of the major trend from these levels.
The likelihood of a successful trade is first increased when trend lines and support/resistance zones are used together in a trading system.
As a result, in chart analysis, the Support&Resistance Indicator can become a vital tool. Almost any trader may use the SR Zones indicator effectively in their trading system thanks to its great efficiency and variety of settings.
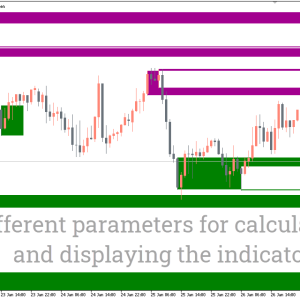
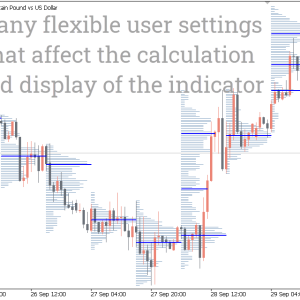
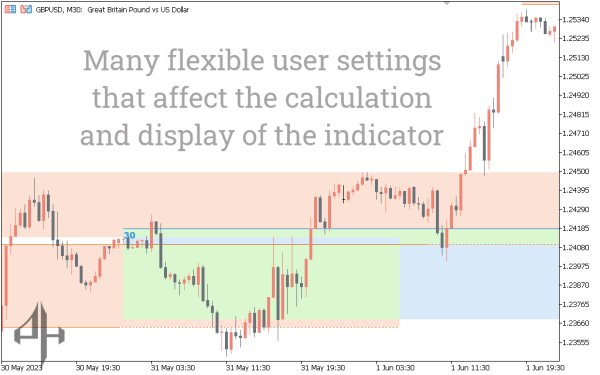
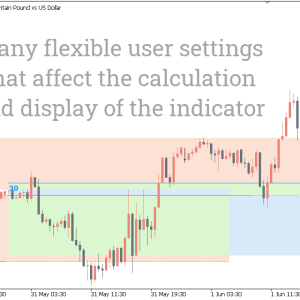
There are multiple settings on the indicator. Nonetheless, any trader may incorporate the support and resistance indicator into his trading system and make good use of it because of its simplicity and informativeness.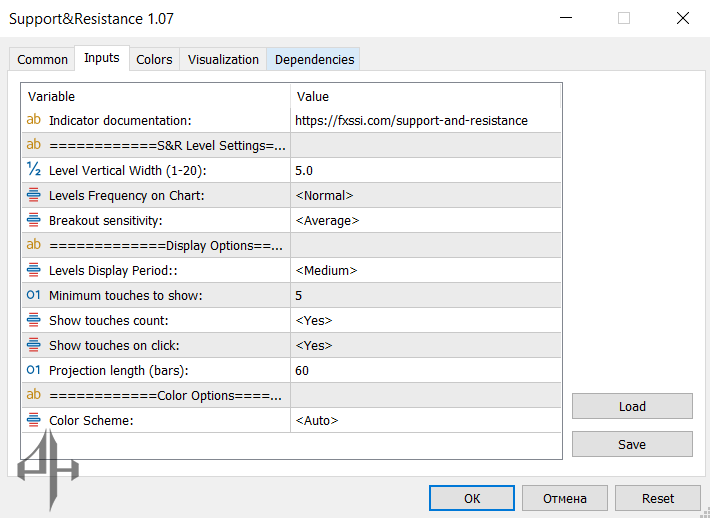
Level Vertical Width – Defines the thickness of support and resistance levels on the chart.
Levels Frequency on Chart – Specifies how many support and resistance levels are shown on the chart.
Breakout Sensitivity – Controls how responsive the indicator is to breakouts. Higher sensitivity means levels are updated less frequently and are removed when broken. Lower sensitivity updates levels more frequently, and minor price moves won’t invalidate them.
Levels Display Period – Sets the time period during which the support and resistance levels are visible.
Minimum Touches to Show – Determines the minimum number of fractal touches required to display a level.
Show Touches on Click – Enables the display of fractals by clicking on the number at the start of a support/resistance level.
Projection Length (Bars) – Defines how many bars into the future the support and resistance levels are projected.
Color Scheme – Selects the desired color theme for the indicator.