- Description
- Indicator Settings
Description
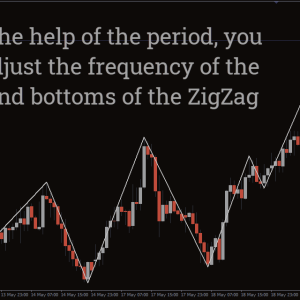
An MT4 indicator that provides information on recent swings is the Swing Point Highs and Lows Indicator. Applying the indicator makes it simple to go long or short.
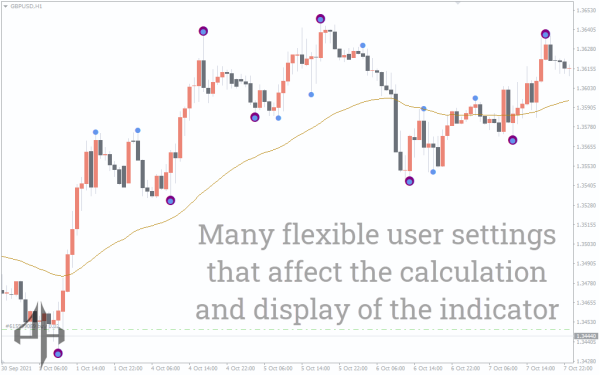
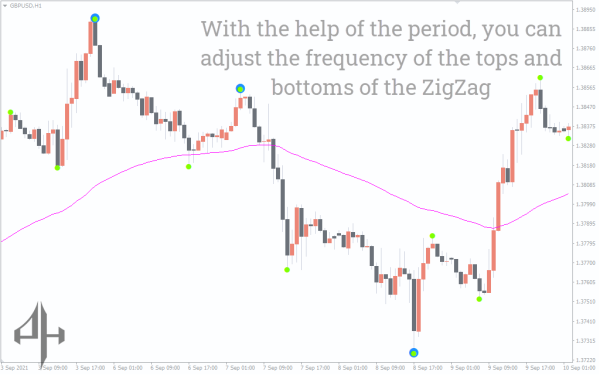
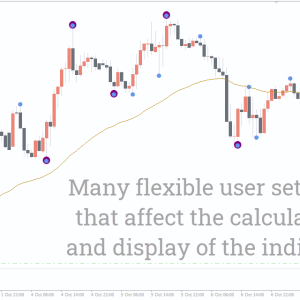
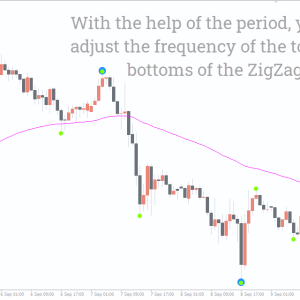
The indicator includes a moving average, major/minor swing colors, and their sizes. Additionally, the indicator draws a main and a small circle if the trend changes.
The moving average serves as a warning indicator to validate the swing highs and lows. As a result, you may have the chance to trade appropriately anytime a trend shifts.
How to trade with the Swing Point Highs and Lows Indicator?
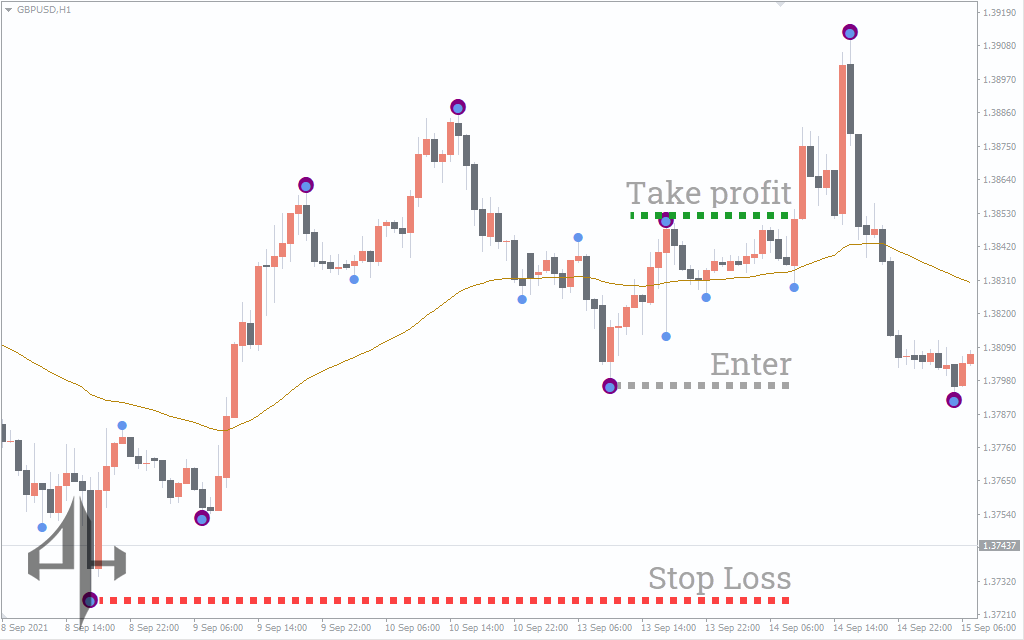
Swing point highs and lows, as previously stated, provide you with a broad overview of recent price swing highs and lows. Because it specifies precisely when to enter long or short, it is the easiest to follow.
The indicator’s built-in EMA serves as a signal confirmation. Because it eliminates pointless market noise, this is very beneficial during periods of high market volatility.
Buy Strategy Using the Swing Point Highs and Lows Indicator:
-
Identify the most recent swing low marked by a circle.
-
Confirm that the prevailing trend is continuing.
-
Enter a long position at the candle where the swing low circle appears, or opt for the following candle for a more cautious entry.
-
Set a stop-loss just below the identified swing low.
-
Place the take-profit target near the next swing high.
Sell Strategy Using the Swing Point Highs and Lows Indicator:
-
Identify the most recent swing high marked by a circle.
-
Ensure the current trend is continuing downward.
-
Enter a short position at the candle where the swing high circle appears, or use the next candle for a more conservative entry.
-
Set a stop-loss just above the recent swing high.
-
Set the take-profit target near the next swing low.
Conclusion
This indicator can be used for any period of time. You can sort through the market noise with the aid of the 55-period EMA. There is a chance of loss with the indication because there is no holy-grail system.
For further signal confirmation, you can pair the indicator with oscillators such as the RSI or stochastics.
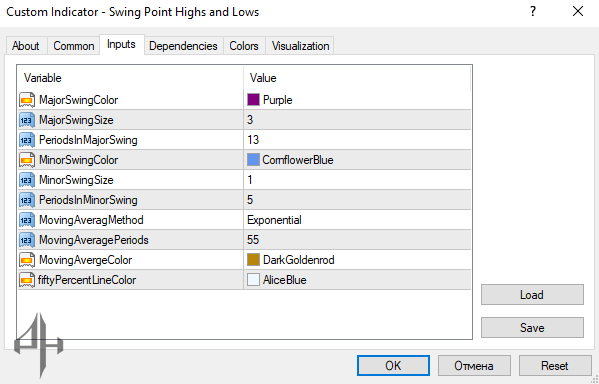
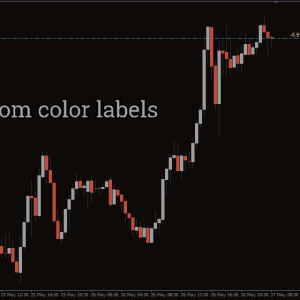
MajorSwingColor: Defines the color used to display major swing circles.
MajorSwingSize (Default: 3): Determines the size of the major swing circles.
PeriodsInMajorSwing (Default: 13): Specifies the number of periods used to identify a major swing.
MinorSwingColor: Defines the color used to display minor swing circles.
MinorSwingSize (Default: 1): Sets the size of the minor swing circles.
PeriodsInMinorSwing (Default: 5): Specifies the number of periods used to identify a minor swing.
MovingAverageMethod: Uses the Exponential Moving Average (EMA) method for trend calculation.
MovingAveragePeriods (Default: 55): Sets the period length for the EMA.
MovingAverageColor: Defines the color of the EMA line.
FiftyPercentLineColor: Specifies the color of the 55-period moving average line (often used as a midline or reference).